Sponsored by HORIBAOct 18 2013
Leading experts generally certify ancient artifacts based on stylistic analysis and on personal sensory perceptions. Nevertheless, greater objectivity is imperative for identification and dating purposes. Although products made from different manufacturing technologies look like the same in external appearance, they have an entirely different micro/nanostructure.
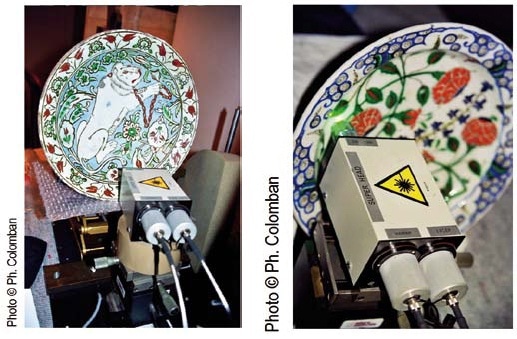
Figure 1. Iznik dishes during analysis with a HE532 and Superhead instrument Musée National de la Céramique, Sèvres, France
Raman analysis of the micro-structure (for ceramics) and nano-structure (for enamels and glasses) is helpful in acquiring information about the production process for identification and dating of historic artifacts (Figure 1). Raman (micro)-spectroscopy is an optical technique that can perform non-destructive analysis of artifacts, both in the laboratory utilizing high-resolution, large spectral window equipment, and on-site utilizing medium resolution, portable instruments.
The Chemistry
All applications in the science, art and technology of enamels, glazes and glass are based on the 3D Si-O network modification in a controlled manner by substituting Si4+ covalent bonded atoms with non-covalent bonded atoms. This, in turn, reduces the number of Si-O bridges and the network connectivity, and as a result modifying the physical/chemical properties associated with the density and network connectivity, such as the viscosity at a specific temperature, melting temperature, reactivity, ion diffusion, and thermal expansion.
Determining the ratio between the glass-former (mainly Si and Al-oxides) and the flux content (Na, K, Ca, Pb oxides) as well as the properties of glassy silicates is crucial (Seeger's rules). Since Raman signatures of strong covalent bonded structures are orders of magnitude greater than those of ionic ones, the signature of the Si-O network forms the basis of the Raman spectrum of a silicate.
Since a SiO4 tetrahedron is a solid chemical and vibrational entity, the different tetrahedral configurations exhibit typical Raman signatures (Figure 2). These configurations include an isolated tetrahedron (Q0); tetrahedra linked by a common oxygen atom (Si2O7 or Q1); tetrahedra linked by sharing 2 oxygen atoms (three (Si3O9) and n tetrahedral-cycles: Q2); and tetrahedra linked by sharing 3 oxygen atoms (Q3, e.g. in some chains, layers and ribbons) and Q4 (as in pure SiO2).
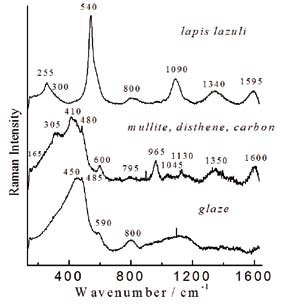
Figure 2. Representative Raman spectra recorded at the laboratory on the glaze-body interface fracture of a Böttgen ewer stopper from ~1725 (MNC 7152); note the lapis lazuli signature (Meissen, Saxony)
A Tentative Guide
Based on six years of experience on different materials, a tentative guide has been proposed for determination and categorization of various kinds of glassy silicates as a function of their composition (1-7) by utilizing two main tools:
- The spectral decomposition of the Si-O stretching peak into its components related to the different types of SiO4 tetrahedra of the silicate polymerized network area
- A new concept that involves the calculation of the polymerization index as the ratio (A500/A1000) of the Si-O bending (~500 cm-1) and stretching (i.e. ~1000 cm-1).
On-site analysis in a museum is illustrated in Figures 3 and 4.
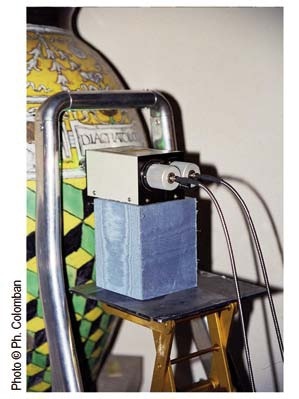
Figure 3. Della Robbia pot, Musée National de la Céramique, Sèvres, France
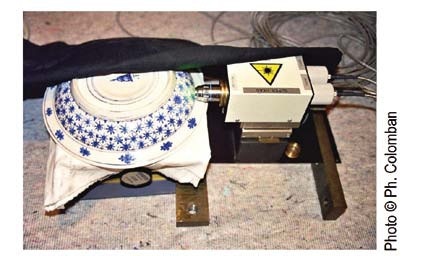
Figure 4. Medici Porcelain, Musée National de la Céramique, Sèvres, France
A systematic and non-destructive analysis is necessary to acquire information about ancient artifacts whose origins are in debate. Using the aforementioned protocols, such artifacts are classified into seven distinct families by plotting the polymerization index as a function of imax, the main Si-O stretching component wavenumber (Figure 5).
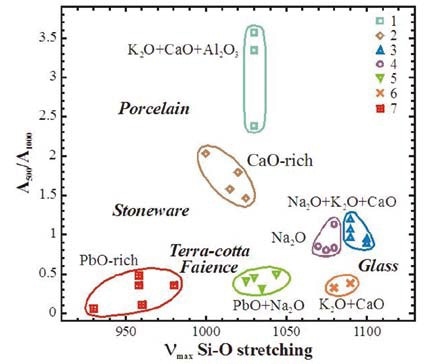
Figure 5. Plots of the polymerization index as a function of the main Si-O stretching component wavenumber
Analysis of Iznik and Kutahya Wares
The history of production of Iznik and Kutahya wares remains a subject of debate among scholars. Moreover, the production of copies or fakes further complicates the problem. Hence, the Iznik and Kutahya wares were undergone the same analysis and classification (Figure 6). Some of the Kutahya glazes can be related to family 7 (PbO-rich glass), but some of them are also found in the Iznik group (e.g. sample 7460).
However, Iznik glazes are all found in between family 4(Na2O-rich silicates) and family 5 (Na2O + PbO) other than two glaze types, which are located in family 2 (CaO-rich) and family 7 (PbO-rich). Hence, the Raman signature of the Iznik production seems to be fairly homogeneous, because the nakkashane, the Ottoman office for décor and drawing, controls Iznik manufacturers.
Alternatively, the significant difference in the Raman signature of the Kutahya glazes highlights the autonomy of different production centers operating in accordance with the Kutahya style. Additionally, the method efficiently differentiates early and late Iznik production on the basis of a minute compositional shift of the silicate glaze at the decline of the production. Hence, the two parameters Ip and νmax seem to be good tools for differentiating and categorizing between Kutahya and Iznik Ottoman pottery.
The colorless/white regions of the samples analyzed always show the comparatively strong Raman signature of â-quartz (Figure 6). The modification of the focal point of the laser by the XYZ plate enables confirming that the a-quartz-rich slip deposited below the glaze provides the white color. This quartz layer is at the origin of the high gloss and strong colored décor. A strong Raman signature, virtually free of any background, is obtained in the strongly colored regions (Figure 6).
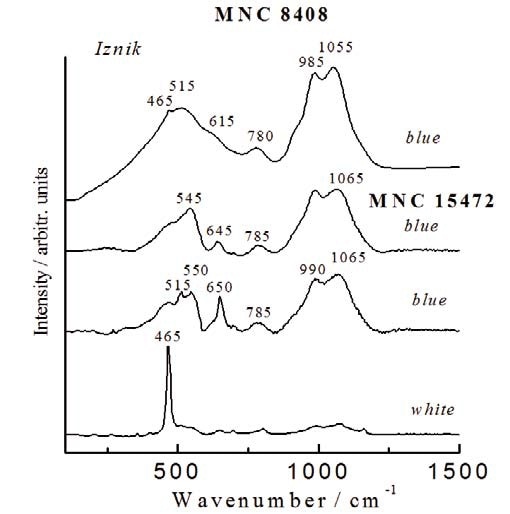
Figure 6. As-recorded spectra for Iznik glazes. Note the very strong quartz fingerprint for white glaze due to the characteristic quartz slip deposited on the body, below the glaze layer.
However, the ways to get a blue glaze are somewhat limited (cobalt (blue), copper in alkaline silicate (turquoise), and lapis lazuli (ultramarine blue)) irrespective of the fluxing agent. The last pigment exhibits a characteristic resonance Raman signature at 532nm laser excitation. No specific Raman signature is anticipated if the dissolution of cobalt (copper) in the glaze is in small quantities.
Saturation results in cobalt mixed silicates or cobalt aluminates. It is possible to use cobalt-containing Mn-rich ores (spinels) as blue pigments when the firing is carried out in a reducing atmosphere. The observed color omits the use of lapis lazuli and copper. The Raman signature of the glaze is only observed in the analysis of most blue regions, indicating the dissolution of cobalt in the glaze network.
Conclusion
The results conclude the value of the Raman microanalysis in characterizing all kinds of ceramic artifacts. The data acquired on the composition of the glaze and pigments are helpful to provide key data on the fabrication and processing of these ancient artifacts. Furthermore, the information may be useful in putting to rest many debates about the origin of the certain pieces.

This information has been sourced, reviewed and adapted from materials provided by HORIBA.
For more information on this source, please visit HORIBA.