Sponsored by HORIBAOct 18 2013
Laser Raman microspectroscopy is a standard analytical method in many gemmological laboratories. This technique is also useful in analyzing luminescence emissions. The set of diamonds analyzed comprises naturally colored gemstones or color enhanced gemstones using a specific treatment (irradiation, heating, etc.).
This article describes an experiment to understand whether the photoluminescence (PL) created by a UV excitation of these diamonds causes significant differences based on the technique utilized for coloring the gemstones. In fact, routine characterizations based on PL analysis enables determining whether the diamond is originally colorless or subjected to a decolorization treatment, such as High Pressure High Temperature (HPHT) treatment. Additionally, PL analyses may be helpful in confirming the use of an appropriate processing in the color enhancement of a diamond.
Instrumentation
This experiment involves the use of a LabRAM HR UV-Vis, which is an integrated and compact 800mm focal length Raman system coupled with an internal He-Ne laser of 17mW at 632.8nm. The system also has an external entry to provide the 325nm line of a Helium-Cadmium laser. The spectral range analyzed covers a wide region between 388nm and 780nm to acquire Raman diffusion and PL emission.
Measurement Conditions
For each diamond, measurements were performed at room temperature and at -100°C. In fact, luminescence bands are considerably sharpened at -100°C, thereby enabling easier determination of the structure and intensity of the luminescence emission and assigning of the luminescence bands to color centers in diamond crystallographic structure.
The color centers in the diamond structure are caused by vacancies and nitrogen atoms. They are categorized under diamond type (Ib, laA, laB) and defect centers (N3, H3, H4, N-V). A temperature-monitored stage enables the samples to be cooled down easily.
Experiment Results
PL spectra of native brown and yellow diamonds were captured and compared with PL spectra of corresponding color-enhanced diamonds. The experiment also included the analysis of PL spectra of artificial violet and green diamonds.
Temperature Effect on PL Spectra
The first spectrum shown in Figure 1 consists of the Diamond Raman band located at 340nm ( 1332cm-1), with luminescence bands from 400nm to 650nm. The luminescence emission is sharpened and intensified when the temperature is lowered, as shown in Figure 2.
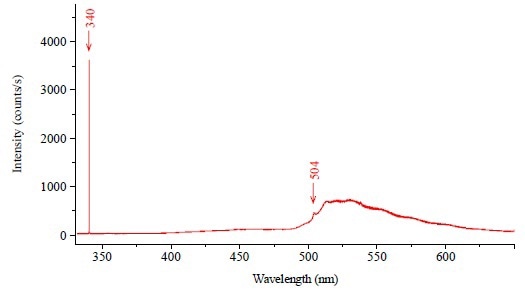
Figure 1. Full spectrum of the natural brown diamond.
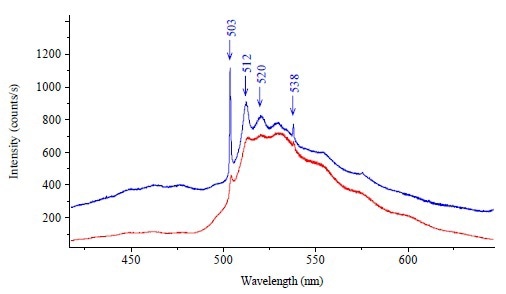
Figure 2. Photoluminescence bands of the natural brown diamond at room temperature (a) and at -100°C (b).
Untreated/Treated and Annealed Brown Diamonds
The PL spectrum of the treated and annealed brown diamond illustrates new bands at 415nm, 496nm and 503nm, which are assigned to N3, H3 and H4 systems, respectively. These systems may be created by the treatment and annealing of the natural brown diamond. Moreover, in the range of 400nm-450nm, there is a modification in the spectrum with a new peak at 415nm. Hence, the PL, emitted around 400-450nm, can provide a characteristic signature of the specific treatment that turns the diamond into brown. Spectra of the natural and treated brown diamonds at -100°C are illustrated in Figure 3.
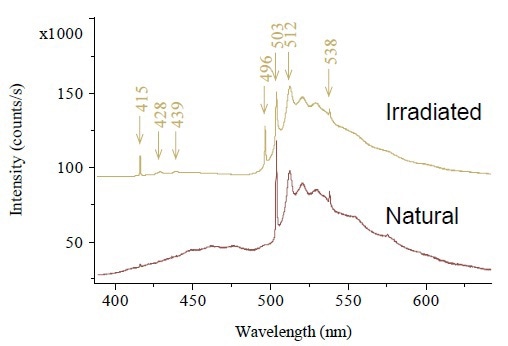
Figure 3. Spectra of the natural and treated brown diamonds at -100°C.
Untreated/Irradiated and Annealed Yellow Diamonds
The color of native yellow diamonds is typically owing to the presence of the N3 system. Hence, the native yellow diamond’s luminescence emission spectrum shows a band at 415nm characteristic of the N3 system.
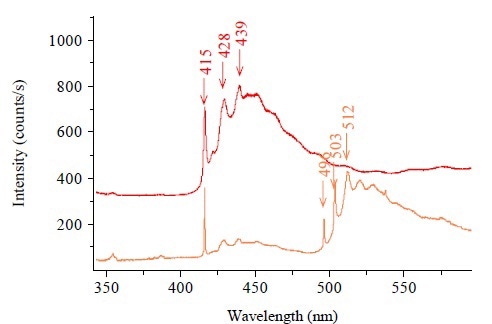
Figure 4. PL bands of the natural and irradiated yellow diamonds at -100°C
The irradiated and annealed yellow diamond’s PL emission spectrum exhibits other bands at 496nm (H3) and at 503nm (H4). These latter PL bands prove the ability of a Raman spectrometer to identify the specific treatment used for enhancing the color of a yellow diamond. PL bands of the natural and irradiated yellow diamonds at -100°C are depicted in Figure 4.
Treated Green Diamond
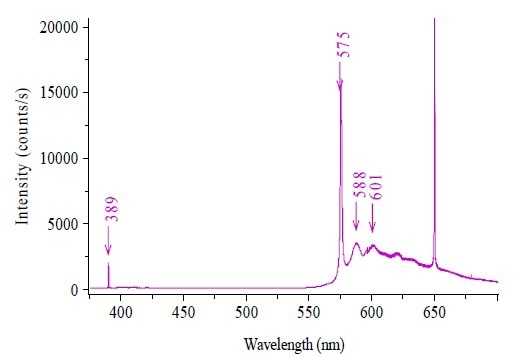
Figure 5. PL bands of the treated green diamond at room temperature.
The treated green gemstone shows features corresponding to H3 and N3 systems (Figure 5).
Irradiated Violet Diamond
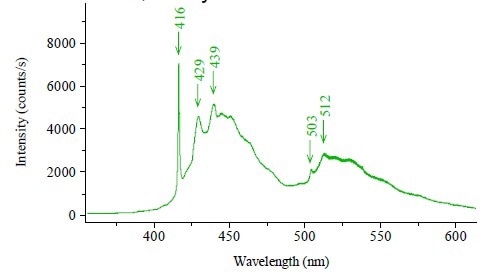
Figure 6. PL bands of the irradiated violet diamond at -100°C.
The PL spectrum of the irradiated violet diamond shows specific features at high wavelengths that are characteristics of N-V centers (Figure 6).
Conclusion
PL analyses carried out with the Raman spectrometer LabRAM HR are able to highlight the color enhancement treatment on native brown and yellow diamonds. They are also able to record the PL signature of green and violet diamonds, and determine and assign the defect centers responsible of the color of the diamonds. These results clearly demonstrate the ability of the Raman spectrometer to explore the fine defects in the diamond structure by PL analysis.

This information has been sourced, reviewed and adapted from materials provided by HORIBA.
For more information on this source, please visit HORIBA.