Sponsored by HORIBAOct 18 2013
The Raman spectra of elemental carbon materials are sensitive to polymorphy. It is possible to band-fit the spectra of amorphous and diamond-like carbons for hard carbon films to decouple the contributions of the "graphitic carbon" (G band) from the "disordered carbon" (D band). A hard carbon film’s characteristic spectrum is illustrated in Figure 1. Since the spectral behavior of carbon films can be empirically correlated with thin film physical properties such as corrosion resistance, thermal conductivity, electrical conductivity, optical transparency, durability and hardness, it can be used for predicting these properties devoid of detailed alternative testing.
Hard carbon coatings protect the magnetic media from wear induced by head sliders. The addition of some amount of hydrogen to the coatings improves the corrosion resistance of the underlying magnetic layer, increases the hardness of the film for enhanced wear resistance, and eliminates friction problems by optimizing interaction with the lubricants. Furthermore, the nitrogen doping decreases the film’s surface resistivity, and thereby static charging without affecting film hardness. The compatibility of the magnetic data storage media with various kinds of read/write heads can be improved with the presence of hydrogen and nitrogen.
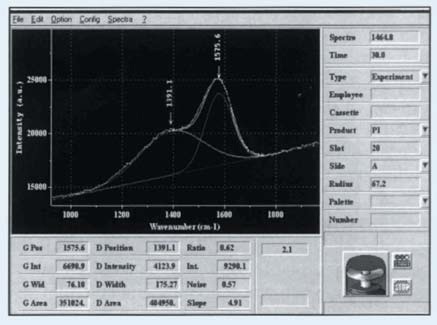
Figure 1. Raman spectrum of Carbon Film recorded and band-fit on the DiskRAM
The DiskRam is designed to rapidly capture the Raman spectra of hard carbon overcoats applied on disk media. The physical properties of interest are derived automatically by subsequent data reduction. These objective can be achieved by curve-fitting the spectrum with two carbon bands (the D and G bands), a baseline, and with additional nitrogen bands if needed. This article reviews the technique employed for the spectral reduction.
The Raman Spectra
An amorphous pure, carbon film’s Raman spectrum consists of the D and G bands over a broad luminescent baseline. The G band normally appears between 1480 and 1580cm-1, and the D band occurs between 1320 and 1440cm-1. The bands are generally overlapping and their actual positions are, to some extent, reliant on the laser excitation wavelength.
The use of red excitation like 632.8nm of the Helium Neon laser causes a smaller separation of the two spectral components and the ensuing curve fit results are more ambiguous. A green excitation is normally used for increasing the spectral separation of the D and G bands by employing the 514.5nm line of an Argon ion gas laser or the 532nm line of a diode-pumped, frequency-doubled, NdYag laser. The NdYag laser is more-energy efficient and can be operated devoid of external cooling fans, a critical feature when cleanroom compatibility is essential.
The blue Argon ion line at 488nm yields even better spectral resolution of the two bands. Films composed of nitrogen exhibit an additional weak band at 2180cm-1, which corresponds to a nitrile CN triple bond stretching vibration. Mathematical methods for extraction of nitrogen concentrations from the Raman signatures are being developed.
Nitrogen-doping of the carbon films significantly decreases the position of the G band, but the D band’s peak position remains relatively stable with rising nitrogen concentration. This means that overlapping of the two Raman bands increases with higher nitrogen concentration. Films composed of constant amounts or nitrogen or hydrogen exhibit a virtually linear relationship of the G peak position with deposition temperature.
Chemometrics Methods
In a recent research effort, advanced mathematical methods were applied to analyze the response of the Raman spectra as a function of the difference in processing parameters as a whole. These Chemometrics techniques delivered very conclusive initial results, which support the use of such methods for more complicated data analysis (Figure 2). It is possible to determine the nitrogen content with an absolute error of ± 0.1% within a range of 7-24%.
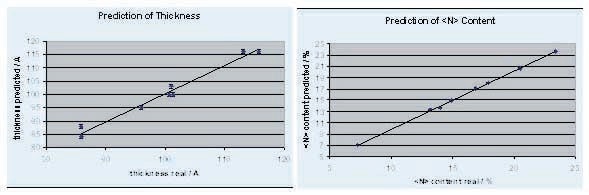
Figure 2. Results of multivariate analysis
As it takes into account more spectral data, the multivariate data analysis can provide quantitative results for other parameters with better overall accuracy. The improved accuracy of these measurements is crucial because of the continuously decreasing size of these structures.
Photoluminescence
Carbon films fabricated in a hydrogen- or methane-containing atmosphere exhibit the Raman bands as well as a photoluminescence background. The photoluminescence is caused by the recombination of electron hole pairs within sp2 bonded clusters in an sp3 bonded amorphous matrix. The increase in hydrogen content in the film increases the intensity of the photoluminescence mainly because of the saturation of non-radiative recombination sites. A spectrum captured using blue 488nm excitation demonstrates that the peak intensity of the luminescence is at around 600nm. The use of red excitation at 632.8nm positions the Raman spectrum near the flank of the broad luminescence peak, causing essentially a flat background (Figure 3).
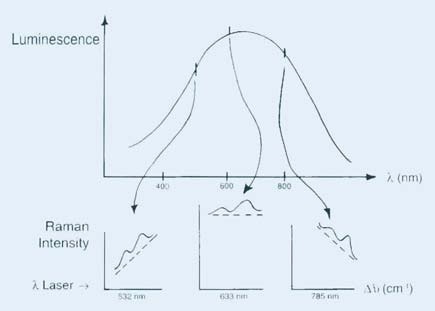
Figure 3. Relationship between Raman spectra and excitation wavelength as determined by fluorescent background
However, the influence of the film thickness on hydrogen content measurement can be avoided by using a laser line in the green or blue, which places the Raman spectrum on the top of the luminescence peak. The excitation with a laser wavelength on the rapidly increasing or decreasing slope of the luminescence peak allows the slope of the luminescent background to measure the amount of hydrogenation. Unlike the total intensity of the background, the slope is not influenced by the carbon film thickness.
Bandfitting the Raman Spectrum
The spectral region of analysis is normally limited to the range of 800-1950cm-1 for the Raman analysis of the hard carbon film properties. The limit is up to 2250cm-1 for nitrogenated films. Gaussian or Lorentzian band profiles, or a Gaussian/Lorentzian sum function can be fitted to the spectra. The baseline can be fitted with the DiskSpec software that allows the use of a polynomial of first, second or third order.
After defining the recipe for the curve fitting in the software, this curve fitting routine will collect all subsequently collected spectra. The parameters obtained from the curve fitting, such as peak intensities, background slope, positions and widths, can be recorded automatically in a spreadsheet matrix format. Otherwise, the data can be routed to an external terminal by the DiskSpec software for statistical process control (SPC).
Hydrogen Content Derivation
As mentioned above, the slope of the luminescence background can be utilized to measure the hydrogen content in the carbon film. Even if the luminescent background and consequently the spectral baseline is not always linear, it is possible to estimate the slope in first instance by choosing two frequency positions across the D and G bands, and defining a slope obtained from the intensities, y1 and y2, at these frequencies. Possible slope definitions are:
y2/y1, (y2-y1)/(y2+y1), or (y2-y1)/y2
Absolute intensity values are influenced by instrumental and sample parameters, including the carbon film thickness, integration time, optical alignment, and laser power. These factors can be cancelled out using relative intensities because the aforementioned parameters will have an equal influence on all spectral intensity values. Methods involving slope and ratio are recommended for manufacturers who want to measure hydrogen content between 0 and 50%.
Calibration Transfer
For manufacturers who perform SPC with various DiskRams, minute variations between instruments need to be rectified to obtain the same results for the same sample from all DiskRams. The DiskSpec software allows for the derivation of standardization coefficients. For this purpose, all DiskRam tools need to be analyzed to find a series of three or more disks that show a large difference in the parameter being measured.
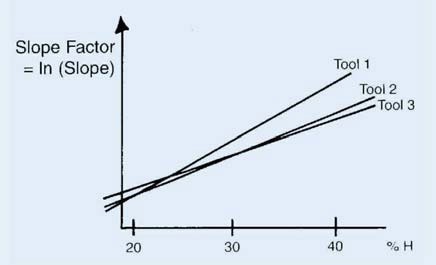
Figure 4. Slope factor vs. % hydrogen recorded on 3 different DiskRAM tools.
The plot of actual vs. measured parameters enables standardizing every instrument to yield the same result for the same sample. This can often be done with a simple correction involving the inclusion of a factor to correct the slope and a coefficient to correct for the offset (Figure 4).
Film Thickness
It is possible to derive the film thickness from the G band intensity normalized for the integration time. The G band intensity needs to be ratioed to the reference sample intensity to offset instrumental effects. For reference samples, the DiskSpec software provides a separate entry of spectra collection and curve fit parameters.
It is possible to define the frequency of the reference measurements in the software by the timeout between references or by the count of actual carbon film measurements between references. A reference measurement can be taken whenever one of these two conditions is satisfied. The determination of a correlation factor can be done by comparison of the actual thickness of a well-characterized carbon film with that measured. This, in turn, allows the system to make the film thickness measurement of unknown production samples in Å’s.
Conclusion
The DiskRam is designed to automate the acquisition of Raman spectra from hard carbon coatings that are applied on computer hard disk media and the derivation of parameters that are in good agreement with the properties of the films. The extracted data is then stored in spreadsheet format for SPC at a production facility.

This information has been sourced, reviewed and adapted from materials provided by HORIBA.
For more information on this source, please visit HORIBA.