Sponsored by HORIBAOct 18 2013
Unlike most metals, metal oxides can be easily differentiated by their characteristic Raman spectra. A Raman microprobe can detect the presence of metal oxides on a micrometer scale.
The significant difference in the Raman spectra of different oxides of a specific metallic ion enables a Raman spectrometer to differentiate the diverse oxide forms of many different metals through a rapid and non-destructive spectroscopic measurement.
This capability of a Raman spectrometer helps engineers or researchers to define the kinetics of oxidation of any of these species by observing the formation of successive species in the event of the oxidation of a raw metal.
Aluminum Metal
Aluminum metal has found use in a variety of technical applications, both as a pure metal and as an element in different lightweight alloys. It resists gross oxidation under normal ambient conditions by forming a thin protective layer of oxide. However, it undergoes oxidation and erosion when exposed to higher temperatures. Gaining insights into the kinetics of oxidation enables passivation of the oxidation process or realistic estimation of mean failure times for components containing aluminum.
There are different forms of aluminum oxide, including the alpha, beta, and gamma phases. Hence, identifying the primary and secondary products of aluminum oxidation lays the cornerstone to understand the oxidation process. Although these oxide products have their characteristic Raman spectra, they are determined more easily by the effect of their typical characteristic crystal structures on the fluorescence of the oxidized form of chromium, which remains as a trace impurity in aluminum metal.
Instrumentation
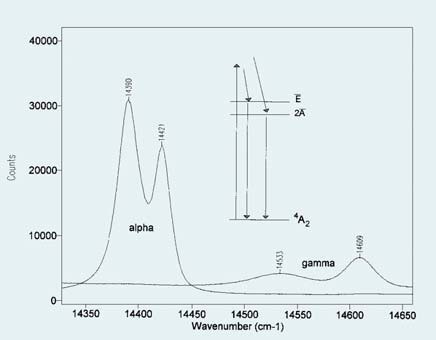
Figure 1. Comparison of fluorescence spectra of alpha and gamma phases of alumina.
The fluorescence spectra of alpha and gamma phases of alumina are compared in Figure 1. The energies of the two transitions are shifted by crystal field effects so that the respective phases yield distinct and non-overlapped spectroscopic signature, as illustrated in Figure 1. These fluorescence bands’ spectral range is narrow enough to be determined simultaneously by a modern Raman spectrograph coupled with a multi-channel CCD detector. Hence, a Raman spectrometer can also serve as a fluorescence emission instrument, thereby enabling users to explore an aluminum surface for the presence of these two species.
The capability to distinguish these two phases is highly helpful when coupled with a microscopic imaging method, which generates a concentration map that plots the intensity of the spectroscopic signature of a specific species as a function of position on the sample. Global imaging, point-by-point confocal imaging, and confocal line scan imaging are the methods available to acquire the images.
The simplest and fastest among the three methods is global imaging, which maps intensity at a specific wavelength as a function of surface position. However, it can miss certain data that can be acquired using the more thorough techniques. Point-by-point imaging employs a combination of motorized computer-controlled microscope stage and a high power microscope objective to acquire a full spectrum for each point on the surface. The microscope optics’ diffraction limit enables a resolution of better than 1µm.
Confocal line scan imaging is a patented method for acquiring the same data as collected by the point-by-point imaging technique, but within a shorter time. By scanning the laser along lines on the sample surface, light is collected from each point on the line. The collected light is then imaged to a distinct position on the spectrograph’s entrance slit, and thereby to a distinct slice of a 2D CCD array detector.
Reading the CCD once yields simultaneously the spectra released by all points on the scanned line. A 2D map of the surface can then be obtained by translating the sample at right angles to the laser scan direction.
Experimental Procedure and Results
Three single NiAl superalloy crystals were heated for 15 minutes ("rare"), 30 minutes ("medium"), and 60 minutes ("well-done"), respectively , at 1100°C. The intensity maps of the alpha and gamma phases for a rare sample are depicted in Figure 2A. Each successive color corresponds to a consistent optimum intensity in the spectral range feature of a specific phase of the oxide. The two plots are apparently complementary.
The alpha phase demonstrates maximum intensity (brightest color) in isolated regions corresponding to minimum intensity (darkest color) in the amps of gamma intensity. It seems that the alpha alumina is present in islands in a sea of the gamma polymorph. The same comparison for a medium sample is illustrated in Figure 2B, showing a fewer number of somewhat larger islands.
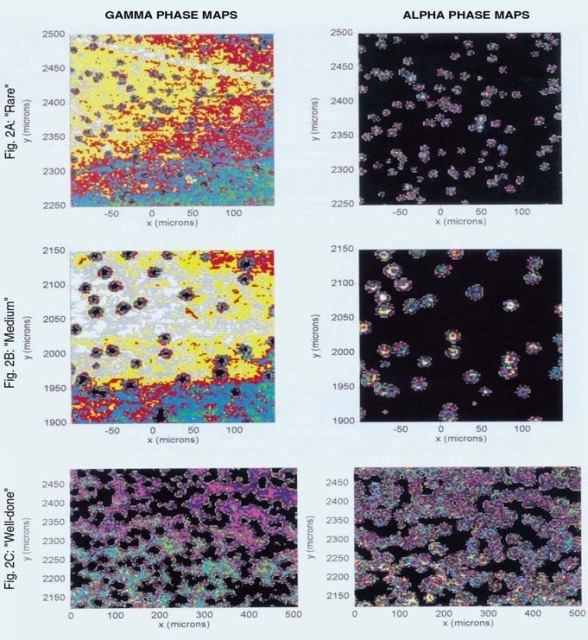
Figure 2. Intensity maps of alpha and gamma phases for ‘rare’, ‘medium’ and ‘well-done’ samples.
The maps of a well-done sample is depicted in Figure 2C, illustrating the growth of the alpha nucleation sites with longer exposure to a point where they overlap with each other and reach total coverage of the mapped region. This concludes that the gamma phase is the principal oxidation product on this surface, and the growth of the alpha phase follows nucleation within the gamma phase.
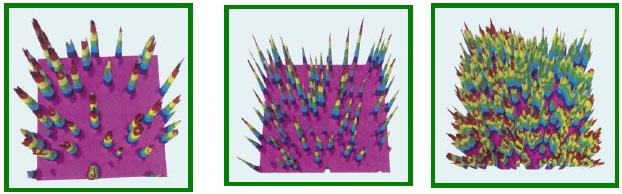
Figure 3. Three-dimensional views of alpha intensity maps.
3D views of these maps present more data which is not straight away visible in the above maps. 3D views of the alpha phase intensity maps depicted in Figure 2 are illustrated in Figure 3. Figure 3A reveals that the islands in the rare sample are inverted cones with maxima in their centers as expected. Conversely, the islands in the medium sample resemble volcanoes, with maximum intensities between their edges and centers, and a crater in the middle (Figure 3B)
The same view of the well-done surface is shown in Figure 3C, where the merging islands retain their volcanic interiors. However, the structural nature of the craters inside these volcanic islands has not yet characterized.
Conclusion
Although the global imaging technique can provide all of these results in principal, further image processing would be required to avoid baseline effects. Nevertheless, this method is not able to provide information intrinsic to these data. Since a full spectrum is collected at each position in the sample, all the typical arsenal of spectroscopic data analysis can be used on the acquired data set, including curve-fitting, intensity rations, and multivariate analytical techniques.
Curve-fitting is the ideal technique for present purposes because of the sensitivity of the R1 and R2 energies to modifications in the local strain of the lattice. Indeed, this dependence enables the fluorescence from ruby crystals to present a pressure calibration of high-pressure cells. Here, the micrometer scale resolution of the probe enables mapping modifications in the strain of these islands when they grow in size. This leads to a non-contact analysis of the dynamic mechanical properties of the sample.

This information has been sourced, reviewed and adapted from materials provided by HORIBA.
For more information on this source, please visit HORIBA.