Sponsored by HORIBAOct 18 2013
Raman microscopy has found use in a myriad of applications, from pharmaceuticals and forensics to semiconductors and mineralogy. The non-invasive technique acquires full spectral data on the microscopic scale. The LabRAM INV (Figure 1) equipped with its inverted microscope is a uniquely configured Raman microscopy that has proven its capabilities in microreactor technology research.
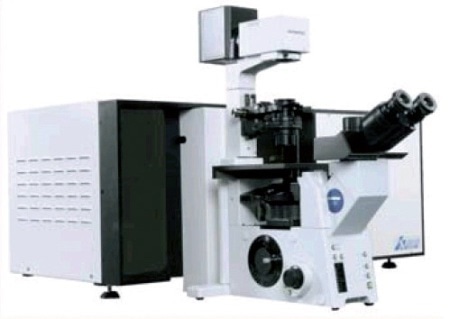
Figure 1. The LabRAM INV
Microfluidic Systems
Microfluidic systems are gaining popularity, thanks to their ability to perform faster chemical analysis at a lower cost. The principles established by miniaturized total analysis systems can be readily used in the development of reactors on the micron scale for organic compound synthesis. The development of a strong research base in this field necessitates the monitoring and characterization of these microreactor systems.
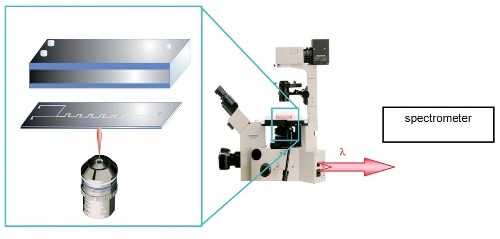
Figure 2. The unique inverted sampling configuration of the LabRAM INV opens up new possibilities for analysis
The LabRAM INV with its inverted geometry enables easy monitoring of microreactors (Figure 2). The reactor can be easily fitted into the usual INV sampling position and all the dosing and electrical connections for the reactor are placed on the normal top face. This configuration allows accurate monitoring of the microchannels from beneath, with mixing and kinetic data set and monitored at different points along its length.
Synthesis of Ethyl Acetate
Preliminary data has been acquired for the acid catalyzed reaction of ethanol and acetic acid for ethyl acetate synthesis. The system was selected for its strong Raman scattering by reactants and products, thereby enabling easy monitoring of the reaction. The ethyl acetate synthesis reaction and the Raman spectra of reactants and product are shown in Figure 3.
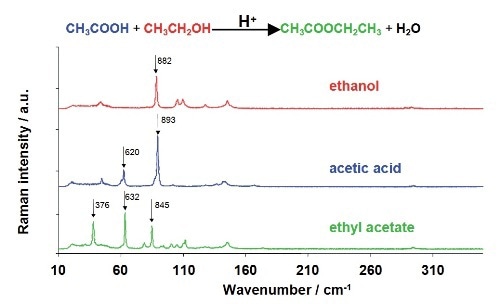
Figure 3. The ethyl acetate synthesis reaction, with the Raman spectra of the individual components shown beneath
Spatial Imaging of Mixtures
Preliminary studies were performed to explore the spatial distribution of components across the T-junction without using any acid catalyst. This approach prevented the formation of ethyl acetate, thereby enabling the full characterization of the distribution of acetic acid and ethanol.
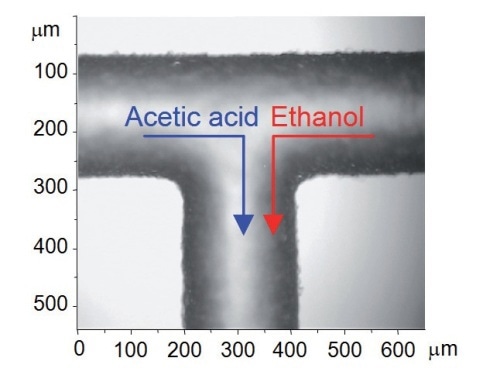
Figure 4. Optical micrograph of T-junction with flow directions shown
Since the flow inside the microchannels is free of turbulence (laminar), the two liquids come into contact at the T- junction and then flow side by side down the channel (Figure 4). Any mixing that takes place only by means of inter-diffusion across the interface between the two laminar streams. This is clearly illustrated in the low resolution Raman mapping over a 375µm x 375µm area (step size ~ 18µm and 25µm in X and Y dimensions) (Figure 5). The 'spike' seen in the left hand side of the cell (Figure 5b) is due to a defect in the glass structure, causing an extraordinarily strong fluorescence signal at that point.
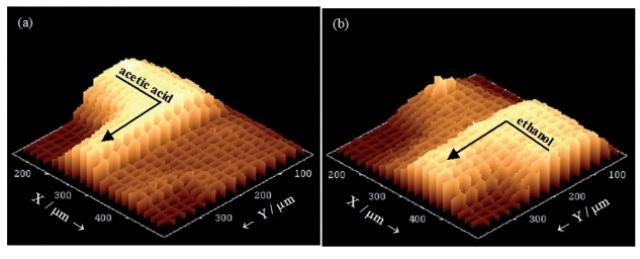
Figure 5. 3D plots of Raman intensity (without background subtraction) in the T-junction region for specific bands. (a) 893 cm-1 from acetic acid. (b) 882 cm-1 from ethanol
Monitoring the Chemical Reaction after Acid Catalyst Addition
After adding the acid catalyst, the chemical reaction involved in ethyl acetate synthesis within the microreactor is then monitored. Analysis at five different sampling points across the center of the microchannel leads to the determination of the ethyl acetate product at the cell center (Figure 6). The band at 845 cm- 1 is apparent at position 3, corresponding to the joining point of the two streams. Positions 1 and 5 at the edges represent the Raman spectra correspond to those acquired for pure acetic acid and ethanol, respectively.
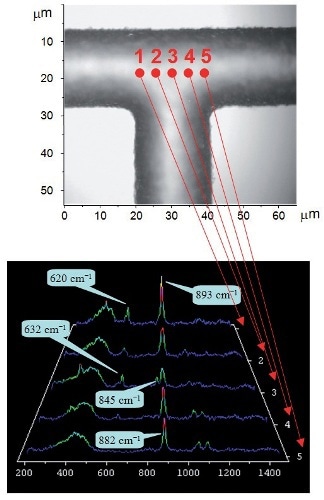
Figure 6. Raman spectra (left) acquired from different positions within the T-junction (shown above)
Concentration Profiles
It is necessary to identify the correlation between Raman intensity and concentration to profile the concentrations of the reactants and product. The deduced linear relation between Raman intensity and concentration for acetic acid, ethanol and ethyl acetate is illustrated in Figure 7. The calibration plots generated enable deducing concentrations from Raman spectra captured at different positions within the T-channel.
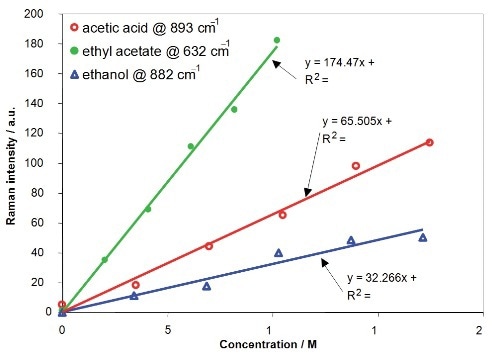
Figure 7. Calibration results of Raman Intensity versus concentration
Figure 8 illustrates the concentration profiles of the reactants and product across the downstream microchannel at two Y positions (Y = 750µm and Y = 3150µm), with respect to contact times of the reactants of 2.3s and 9.8s, respectively. The profiles show that the concentrations of reactants and product rely on both X position (an indicative of the diffusional mixing of the reactants) and Y position (with respect to increasing time for reaction). The product concentration profile is asymmetric due to mild variations in diffusion speeds and viscosities of the reactants in the mixing region.
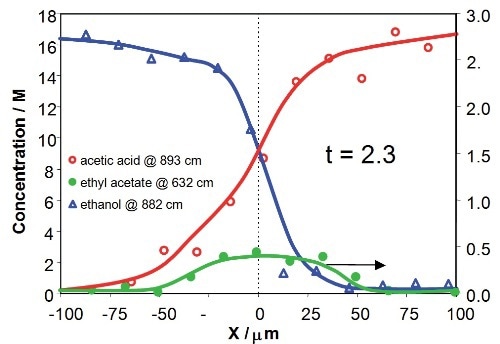
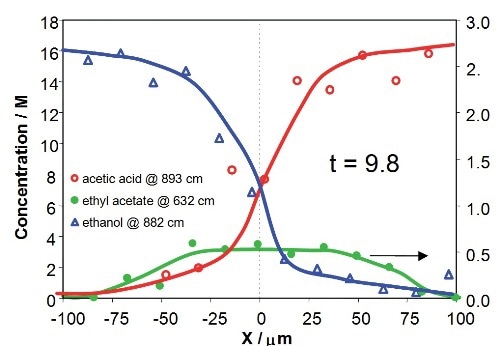
Figure 8. Concentration profiles for acetic acid, ethanol and ethyl acetate across the downstream channel at different Y positions, corresponding to 2.3s and 9.8s after initialization of reaction
Conclusions
The inverted microscope configuration of the LabRAM INV provides the flexibility ideal for in situ Raman measurements in microreactor channels. The instrument acquires information on mixing, flow properties and reactions within microchannels, thereby enabling optimization of reactions. Especially, the Raman concentration imaging technique is useful in testing and evaluating mathematical simulations of organic reactions in these microreactor systems.
The LabRAM systems deliver true confocal performance, thereby providing the best possible spatial resolution to analyze the Raman signal with minimal interference from background effects. Additionally, the capability for multiple laser wavelengths makes the instrument to study a wide range of reactions.

This information has been sourced, reviewed and adapted from materials provided by HORIBA.
For more information on this source, please visit HORIBA.