Sponsored by m-oemNov 15 2013
Compact spectrometers coupled with fiber optic light inputs and array detectors are used for many different spectroscopic applications. Traditionally, poor detection limit is one of the shortcomings of this design, especially for low light level applications like fluorescence and Raman spectroscopy.
This performance degradation is mainly caused by the higher noise qualities associated with non-cooled detectors.
Nevertheless, advances in thermoelectrically (TE) cooled spectrometers have resulted in drastically reduced noise specifications. This, in turn, leads to lower detection limits by enabling longer signal integration times.
This article demonstrates the advantages of a TE cooled spectrometer by comparing the equipment with a non-cooled instrument, configured for both fluorescence and Raman spectroscopy.
Detector Noise
Theoretically, the total noise of any detector is estimated by taking the square root of the sum of all of the noise components. Readout noise, shot noise, dark noise and fixed pattern noise are the four key noise sources found in an array detector.
TE Cooling
Dark current noise of an array detector can be effectively reduced by cooling it with an integrated thermoelectric cooler (TEC). This approach improves the dynamic range and lowers the detection limit. According to study results, when there is an increase in temperature by roughly 5-7°C with silicon-based charged-coupled device (CCD) array detector, the dark current goes up by a factor of two. Similarly, the dark current goes down by a factor of two when there is a decrease in temperature by the same amount.
Figure 1 illustrates the dark current noise for a TE cooled spectrometer operated at 14°C and a non-cooled CCD spectrometer at room temperature, for an integration period of 30 seconds. The estimated RMS noise level of the TE cooled spectrometer is roughly five times lower than that of the non-cooled device.
The dark noise reduction by TE cooling is not useful when a CCD based spectrometer is applied for less challenging, high light level applications like LED measurements because the dominant noise component is the readout noise when comparatively short integration times are utilized (~ 200ms).
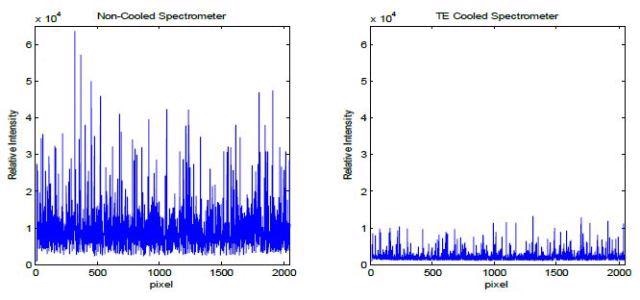
Figure 1. Dark current noise for a non-cooled CCD spectrometer at room temperature (left) and a TE cooled CCD spectrometer at 14°C (right), using an integration time of 30 seconds
Advantages of TE Cooled Spectrometer in Low-Light Applications
To demonstrate the advantages of a TE cooled spectrometer in low light applications, the Glacier X, a TE cooled spectrometer from B&W Tek, was used to generate the data in this analysis. This device basically uses a compact high-performance TE-cooled 2048 pixel CCD detector at 14°C. The optical bench uses a crossed Czerny-Turner spectrograph design with a resolution of < 0.2nm.
Fluorescence Spectroscopy
Fluorescence spectroscopy involves analyzing a molecule by exciting it with a high-energy photon, which transits the electrons from a ground state to a higher energy, excited state. When the electrons return to the ground state, they release photons at a characteristic light wavelength equal to the difference between the energy levels. Hence, the basic correlation between the energy and frequency of the emitted light can be used to study the different electronic and vibrational states of a molecule.
This is illustrated in Figure 2, which depicts a comparison of fluorescence spectra of a quantum dot composed of a cadmium selenide (CdSe) core and a zinc sulfide (ZnS) shell that is engineered to emit fluorescence at 584nm. These measurements are performed by means of a UV excitation source and are acquired utilizing a collimating lens and a fiber optic patch cord linked to a TE- cooled spectrometer (red) and non-cooled spectrometer (blue).
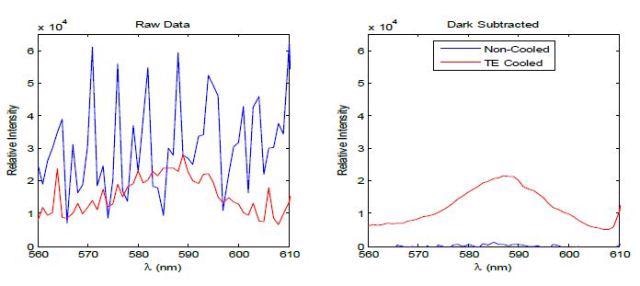
Figure 2. A comparison between a non-cooled (blue) and TE-cooled (red) spectrometer showing the fluorescence spectra of a quantum dot engineered to fluoresce at 584nm.
The analysis of the raw data plots confirms that the noise of the non-cooled device is considerably higher than the TE cooled unit. This noise signal makes it difficult to differentiate the 584nm fluorescence peak on the non-cooled unit from the noise. Conversely, the 584nm fluorescence peak can be observed clearly in the spectrum acquired using the TE cooled system.
Raman Spectroscopy
Raman spectroscopy measures light wavelengths’ rotational, vibrational, and other low-frequency interactions with a molecule of interest.
The Raman Effect takes place during the absorption of the incident photon by the molecule. As a result, the electrons are excited to a virtual state equal to the photon energy. While most of the electrons fall back to the ground state and release a photon of same energy to the incident photon, some excited electrons will drop down to an intermediate energy state prior to returning to the ground state.
During this event, the molecule releases a lower energy photon and the energy difference is equivalent to the vibrational energy of the bond. This process of the Raman Effect is called Stokes scattering, and happens only in 1 out of every 106 incident photons.
There is also a possibility that the photon will gain energy equivalent to the vibrational energy. This process is termed as anti-Stokes scattering, which is typically much weaker when compared to Stokes scattering. Since the wavelength is determined by the energy of a photon, Raman spectroscopy can analyze and identify vibrational states of molecular bonds by measuring the wavelength change from a monochromatic excitation source.
Integration of the signal for prolonged durations is essential to make scattered light measurements due to the low probability of occurring of the Raman Effect. This makes it highly difficult to employ a conventional, non-cooled spectrometer for performing Raman studies.
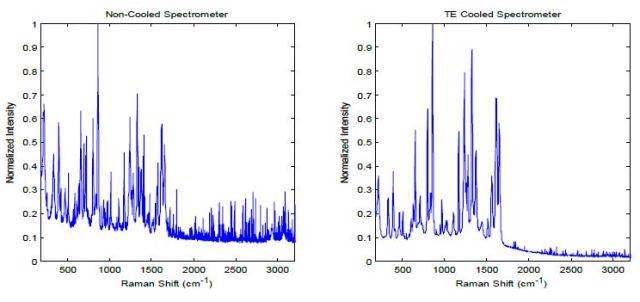
Figure 3. Raman spectrum of acetaminophen collected using a non-cooled spectrometer (left) and a TE-cooled system (right)
The convenience of a TE-cooled spectrometer over a non-cooled device in the assessment of Raman spectrum of acetaminophen is illustrated in Figure 3. Acetaminophen is a weakly scattering material and therefore the integration time for both spectrometers set was 7 seconds. The spectral data clearly shows the higher dark current noise level for the non-cooled system that makes all the Raman peaks in the spectra indistinguishable. Conversely, the TE-cooled spectrum depicts well-defined Raman peaks, with much lower base-line noise.
Conclusion
The study results clearly demonstrate that TE cooling significantly reduces the dark current noise by lowering the temperature of a spectrometer’s CCD detector. This setup enables longer signal integration times in low-light applications, such as fluorescence and Raman spectroscopy, where it is often very difficult to distinguish the analyte signal from the background noise. These longer signal integration times lead to better long-term stability, wider dynamic range. Lower detection limits and less noise.

This information has been sourced, reviewed and adapted from materials provided by B&W Tek.
For more information on this source, please visit B&W Tek.