The past ten years have witnessed the development of handheld and portable tools, which has introduced new valuable analytical capabilities to quality assurance, quality control and manufacturing traceability in the pharmaceutical industry. The performance of these devices has considerably improved and in certain cases can generate data quality equivalent to laboratory grade bench instruments.
A widely used portable technique for rapid identification of unknown compounds is Raman spectroscopy. This article covers the two most common mathematical representations used with handheld Raman spectroscopy as decision making tools for spectroscopic data, which are Hit Quality Index (HQI) and significance level (p-value). HQI is the choice method for library matching of unknown materials and p-value is ideal for verifying the identity of a known material.
Library Matching
Library matching is a popular method in spectroscopy for investigating unknown materials from a NIR, FTIR or Raman spectrum. This is performed by cross-correlating the measured spectrum of a material against a validated library of spectra of known materials. The degree of similarity of each potential match is then quantified by a calculation of HQI defined by,

HQI signifies the spectral correlation coefficient between the two spectra by taking the dot product of the library spectra and the unknown material squared, divided by the dot product of the library spectrum with itself multiplied by the dot product of the unknown spectrum with itself. HQI value ranges between 0 and 1 and while scaling by 100 a perfect match would be 100.
Library matching is primarily used as a tool for investigation of unknown materials, where one needs to quickly compare the spectrum of an unknown material against a number of potential spectral matches, as shown in Table 1.
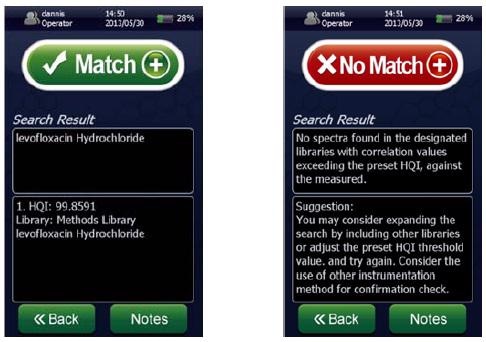
Figure 1. Screenshots of a spectral “Match” for levofloxacin hydrochloride showing a ~100% HQI (left) and a spectral “No Match” (right) using the NanoRam (B&W Tek, USA) in investigation mode.
Table 1. HQI results for Raman spectra of amino acids compared with each other
| Library |
L-Alanine |
L-Aspartic Acid |
L-Cysteine Hydrochloride |
| Spectrum Sample |
| L-Alanine |
HQI=100 |
HQI=1.63 |
HQI=0.66 |
| L-Aspartic Acid |
HQI=1.63 |
HQI=98.88 |
HQI=1.71 |
| L-Cysteine Hydrochloride |
HQI=0.52 |
HQI=2.22 |
HQI=99.19 |
| HQIs ≥ 95 |
80 < HQIs < 95 |
50 < HQIs ≤ 80 |
HQIs ≤ 50 |
Identity Verification
For verifying the identity of a known material, it is important to use a more advanced statistical approach, to ensure that the probability for the material being what it is supposed to be is above a certain threshold (typically 95% confidence).
This article focuses on the Soft Independent Modeling of Class Analogy (SIMCA) method which was pioneered by Svante Wold in the 1970s and 1980s and is presently used in the NanoRam handheld Raman spectrometer (B&W Tek, USA). This multivariate analysis approach is based on developing principal component analysis (PCA) models for each material to model the structured variance of each class, is a widely used classification tool.
SIMCA is based on determining the similarities within each class, making it ideal for verification of known compounds. The SIMCA method is summarized as follows:
-
Measure a training spectra set for a desired material using a sample set of materials that have been verified using an approved analytical method
-
Develop a principal competent analysis (PCA) model with the training set and establish the membership limits based on a 95% confidence level.
-
Measure the spectrum of a new sample, and project it onto the PCA model to see if it lies within the model limits.
The definition of the p-value is the probability of obtaining an observed value more extreme than your estimated result when there is no effect in the population.
Figure 3 shows the results of three methods which were developed on the NanoRam (B&W Tek, USA) for L-alanine (I), L-aspartic acid (II), and L-cysteine hydrochloride (III).Their structures are quite different and could be identified unambiguously using an HQI value as previously shown in Table 1.
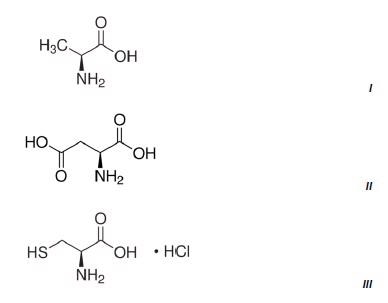
Figure 2. Chemical structures of the three amino acids measured.
Figure 3 shows the Raman spectrum of L-alanine, L-aspartic acid and L-cysteinehydrochoride.
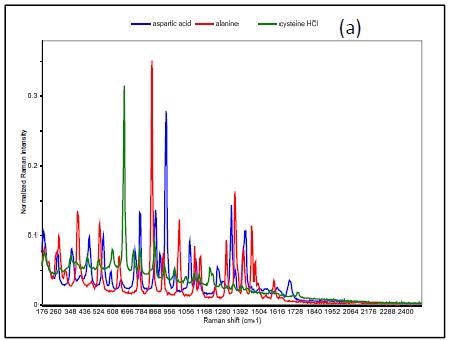
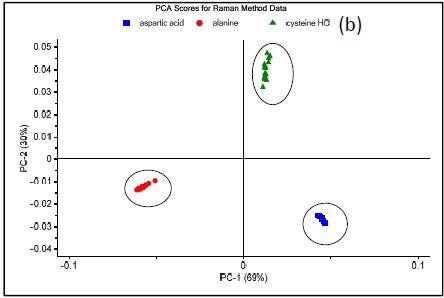
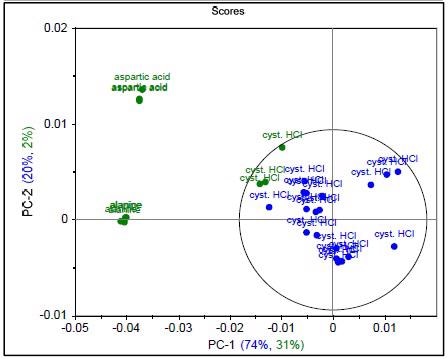
Figure 3. Raman spectrum of L-alanine, L-aspartic acid, and L-cysteine hydrochloride (a), PCA scores plot of all three samples showing unique clusters (b), PCA scores plot for the results of SIMCA-based identification of L-cysteine hydrochloride (c).
Figure 4 shows that the result permits the statistical determination of a “pass”/“fail” decision when analyzing a measured spectrum. To summarize the results of these models and demonstrate specificity, a proximity matrix is shown in Table 2 which demonstrates that when the test samples were run against each of the three methods, each one passed for its correct method.
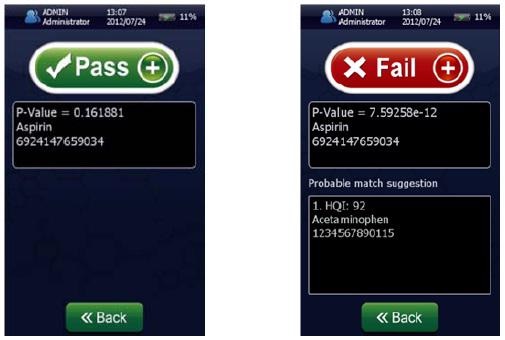
Figure 4. Screenshots of an identification “Pass” for Aspirin showing p-value = 0.161881 (left) and a identification “Fail” (right) for Aspirin showing a p-value of 7.59258 x 10⁻¹² using the NanoRam (B&W Tek, USA) in the identification mode.
Table 2. p-Value results for Raman spectra of amino acids compared with each other
| Method Sample |
L-Alanine |
L-Aspartic Acid |
L-Cysteine Hydrochloride |
| L-Alanine |
Pass p=0.7945 |
Fail p=7.772 x 10⁻¹⁶ |
Fail p=1.776 x 10⁻¹⁵ |
| L-Aspartic Acid |
Fail p=7.661 x 10⁻¹⁵ |
Pass p=0.8915 |
Fail p=7.25 x 10⁻¹⁴ |
| L-Cysteine Hydrochloride |
Fail p=8.436 x 10⁻¹¹ |
Fail p=2.26 x 10⁻¹¹ |
Pass p=0.9995 |
| p-value > 0.05 |
0.001 < p-value ≤ 0.05 |
10-6 < p-value ≤ 10-3 |
0 < p-value ≤ 10-6 |
Qualification of Potassium Carbonate and a Hydrate
For similar materials, a correlation approach may not provide definitive identification results, as similar spectra may have HQI values that vary only slightly.
A good example is the discrimination of potassium carbonate (K2CO3) (IV) from potassium carbonate sesquihydrate (K2CO3 H2O) (V), which differ only in the presence of a water molecule. Their Raman spectra are very similar, dominated by the in-phase CO3 stretch vibration at 1060cm-1 as can be seen in Figure 6.
The sesquihydrate has multiple bands for the CO3 out of plane deformation near 700cm-1, and this is seen as a single peak at 688 cm-1 in the potassium carbonate. Since the HQI is based on spectral correlations that are not sensitive to subtle changes in data, these materials have HQI values of more than 96 for both of the compounds, thus making use of HQI for unambiguous identification difficult, as shown in Table 3.
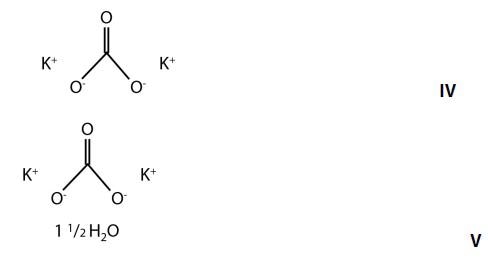
Figure 5. Chemical structures of potassium carbonate and potassium carbonate sesquihydrate.
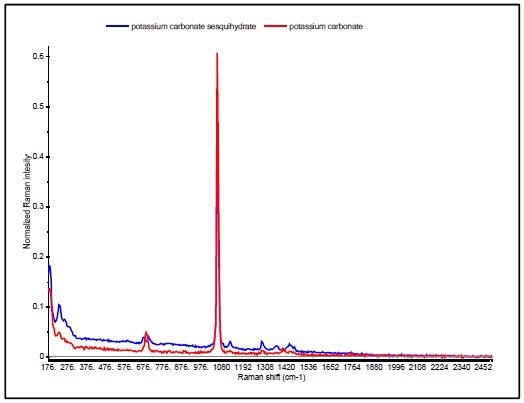
Figure 6. Raman spectra of potassium carbonate (red) and potassium carbonate sesquihydrate (blue).
Table 3. HQI values for samples measured in investigation mode on the NanoRam (B&W Tek), which utilizes spectral library matching.
| Library Spectrum Sample |
Potassium Carbonate |
Potassium Carbonate Sesquihydrate |
| Potassium Carbonate |
HQI=99.5590 |
HQI=96.9013 |
| Potassium Carbonate Sesquihydrate |
HQI=97.5834 |
HQI=99.5908 |
| HQIs ≥ 95 |
80 < HQIs < 95 |
50 < HQIs ≤ 80 |
HQIs ≤ 50 |
Methods were developed for each on the NanoRam (B&W Tek). The steps were as follows:
-
For each material, 20 Raman spectra were collected using 4 samples of the material and the method builder automatically generated the PCA model based on spectral data upon completion of the 20 scans resulting in a model rank such that 90% of the spectral variance is explained.
-
Next, the samples were tested in identification mode on the NanoRam, which automatically projected the newly-collected Raman spectrum onto the selected PCA model (Method), and a pass/fail result (based on a 95% confidence) was reported based on the probability that a sample does match the method.
-
A fail result caused the system to automatically perform a spectral library search and probable matches were returned based on the HQI of the sample to materials that are in the system spectral library and methods library.
Five samples were then tested against both methods with the NanoRam (B&W Tek). The results shown in Table 4 show that using the SIMCA method of material classification, it is possible to qualify the identity of both hydrate and potassium carbonate.
Table 4. Summary of p-values for samples tested in identification mode against given methods
| Library Spectrum Sample |
Potassium Carbonate |
Potassium Carbonate Sesquihydrate |
| Potassium Carbonate |
p-value = 0.9639
0.9755
0.9825
0.9998
0.9262 |
p-value = 6.415 x 10⁻⁴
2.990 x 10⁻⁴
2.597 x 10⁻⁴
6.153 x 10⁻⁵
4.077 x 10⁻⁵ |
| Potassium Carbonate Sesquihydrate |
p-value = 1.258 x 10⁻⁵
1.979 x 10⁻⁵
4.132 x 10⁻⁵
3.245 x 10⁻⁵
3.106 x 10⁻⁵ |
p-value = 0.9997
0.9534
0.9902
0.9919
0.9942 |
| p-value > 0.05 |
0.001 < p-value ≤ 0.05 |
10-6 < p-value ≤ 10-3 |
0 < p-value ≤ 10-6 |
Conclusion
Present handheld spectroscopic analyzers use built-in processing algorithms to automatically perform complex analysis, making these tools much more accessible to the general user. However, it is possible that there is a misuse of the technology if the advantages and disadvantages of the algorithms are not understood.
Hence one must understand that both correlation and multivariate approaches to spectral analysis have their advantages and disadvantages depending on the goal of the measurement.
HQI enables the rapid comparison of a spectrum against a large library of spectra, making it ideal for analysis of unknown materials, whereas p-value is ideal for verifying and/or qualifying the identity of a “known” material.
Multivariate analysis offers a highly robust methodology and has the added advantage of being able to discriminate between molecules that have structural similarities.

This information has been sourced, reviewed and adapted from materials provided by B&W Tek.
For more information on this source, please visit B&W Tek.