The self-association of macromolecules in solution, including insulin1,2, can be quantified using composition-gradient multi-angle light scattering (CG-MALS). CG-MALS enables rapid, reproducible, label-free quantification of biomolecular self-association.
This technique measures the change in weight-average molar mass as a function of concentration to determine the absolute stoichiometry and affinity of these interactions. While a semi-quantitative study of insulin self-association may be carried out by coupling MALS instrumentation to size-exclusion chromatography3, this article describes the use of CG-MALS to quantify the self-association of insulin at neutral pH in the absence of zinc, identifying a progressive, isodesmic self-assembly process.
Sample Preparation and Instrumentation
Human insulin samples were prepared in a buffer composed of 20mM sodium phosphate pH 7.2, 0.1M NaCl, 1mM EDTA and measured by means of an extinction coefficient of 1.05 AU/(g/L*cm) at 276nm. Insulin solutions and buffers were filtered using Anotop syringe-tip filters with 0.02µm pore size by centrifugation at 2500g for 15 minutes. Experiments were carried out at 25°C in duplicate using two stock concentrations of either 3.2mg/ml or 0.3mg/ml.
CG-MALS experiments were performed using a Calypso II to produce concentration gradients in line with a Shimadzu SPD-6AV UV/Vis spectrometer and a mini-DAWN TREOS three-angle light scattering photometer (Figure 1). The CALYPSO software was used to fit the light scattering and concentration data to different self-association models to identify the association scheme that best delineated the data.
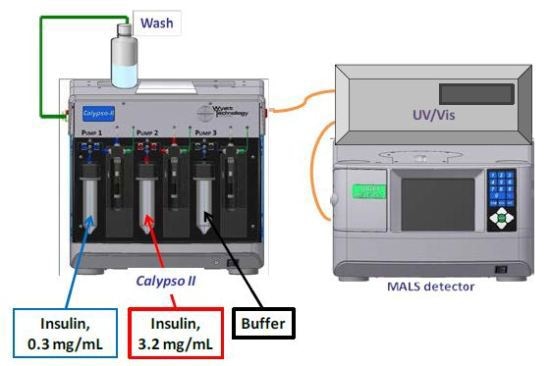
Figure 1. Calypso Hardware Set-up.
Experimental Results
As expected, the measured light scattering and concentration data for insulin are characteristic of a self-associating molecule (Figure 2). Although the maximum measured Mw under these conditions (38kDa) is that of a hexamer, the increase in molar mass with concentration cannot be described by a simple model of monomer-hexamer equilibrium 6I⇄I6 with an equilibrium association constant, KA=[I6]/[I]6. As illustrated in Figure 2, this type of assembly underestimates the measured Mw by as much as 30% for concentrations below ~0.2mg/mL (34 µM) and overestimates the Mw by as much as 25% for concentrations between 0.2 and 2mg/mL (34-340 µM).
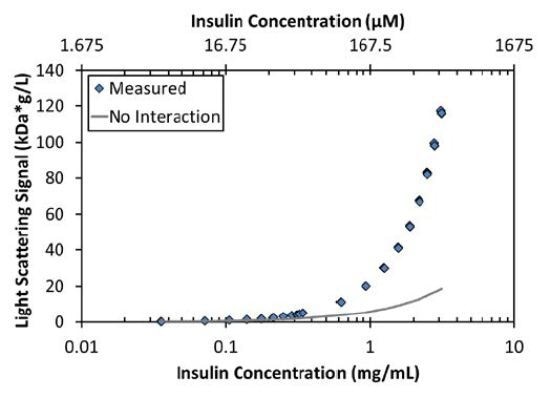
Figure 2. The measured LS signal as a function of concentration (blue diamonds) is significantly greater than the expected LS signal for a non-interacting monomer with Mw = 6kDa (gray line).
Rather, the light scattering and concentration data are best fit by an isodesmic self-assemble model. According to this model, each insulin monomer couples to a growing insulin cluster with constant affinity as follows:
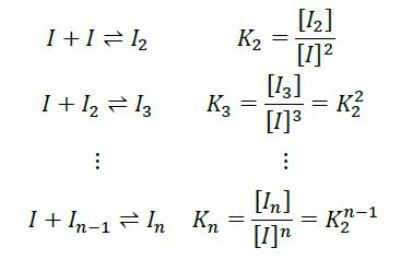
The equilibrium association constant K2 is related to the affinity per binding site, KD=1/ K2. For the data shown in Figures 2 and 3, the best fit is isodesmic self-assembly with affinity KD = 52µM.
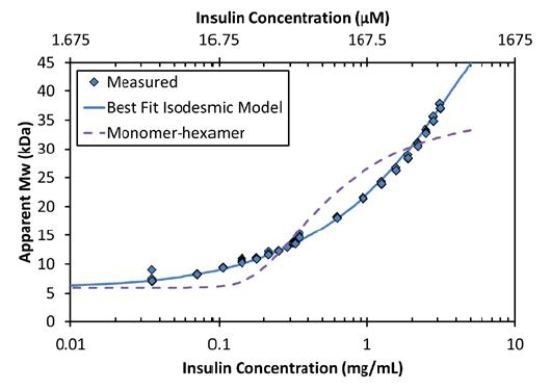
Figure 3. The increase in Mw as a function of concentration corresponds to an isodesmic self-association (solid line) and is not characteristic of a simple model of monomer-hexamer equilibrium (dashed line).
The self- association model can be used to calculate the equilibrium distribution of oligomers, as shown in Figure 4. As the total concentration reaches the isodesmic binding site affinity (~50µM or 0.3mg/mL), insulin molecules self-associate, and the monomer fraction in solution rapidly decreases, indicating the self-association of insulin molecules. At concentrations above ~0.6mg/mL (~100µM), even the dimer fraction decreases due to the formation of higher order oligomers.
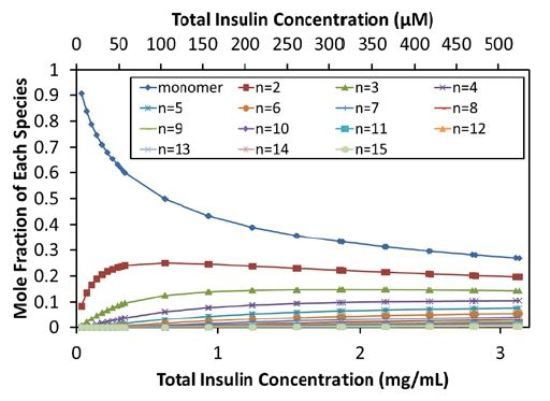
Figure 4. Equilibrium distribution of species.
At the maximum concentration measured (~500µM), monomers represent only 27% mol/mol and dimers 20% mol/mol. Figure 4 provides the molar compositions up to 15-mers, which represent 0.3% mol/mol of the stock solution.
Conclusion
The results clearly demonstrate the ability of CG-MALS to quantify the isodesmic self-assembly of human insulin in the absence of zinc. Even though the overall Mw only increased by ~6-fold over the concentrations studied (~0.3-3mg/mL, ~5-500µM), the Mw change as a function of concentration is not described well by simple monomer-hexamer equilibrium. Instead, a true description of the complexes present at equilibrium needs to consider higher order insulin oligomerization, including species containing >10-mer under these conditions.
References
Adapted from "Self-Association of Insulin Quantified by CG-MALS" white paper by Wyatt Technology. Graphs and illustrations reprinted with permission from Wyatt Technology.
- Arun K. Attri, Cristina Fernández, Allen P. Minton., (2010). pH-dependent self-association of zinc-free insulin characterized by concentration-gradient static light scattering. Biophys. Chem., Vol. 148, 28-33.
- Arun K. Attri, Cristina Fernández, Allen P. Minton., (2010) Self-association of Zn-insulin at neutral pH: Investigation by concentration gradient-static and dynamic light scattering. Biophysical J., Vol. 148, 23-27.
- Application of Column Chromatography (SEC/GPC) and MALS for Characterizing Monomers, Dimers, Hexamers and Aggregates of Insulin

This information has been sourced, reviewed and adapted from materials provided by Wyatt Technology.
For more information on this source, please visit Wyatt Technology.