Branching is a key structural parameter of many natural and synthetic polymers and has a considerable impact on a variety of properties. These properties include viscosity and rheological behavior of melts and polymer solutions; the ability to crystallize or dissolve; and various mechanical and thermodynamic properties. Quantitative data related to branching topology is important for the development of new polymer-based materials with improved properties and for understanding polymerization processes.
This article provides a brief synopsis of fundamental principles of the detection and characterization of branching using multi-angle static light scattering (MALS) detector.
History and Theory of Branching Characterization
The history of branching characterization started with a prominent 1949 article by Zimm and Stockmayer who introduced a theoretically derived parameter known as the branching ratio, g:
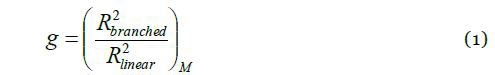
where R2 represents the mean square radius of branched and linear macromolecules having the same molar mass (M). The branching ratio, g, is directly related to the number of arms in star-branched polymers or to the number of branch units in randomly branched polymers. The value of g is ≤ 1, where the equality sign is applicable for linear polymers. The lower the value of g, the higher the degree of branching. For instance, a value of g ≈ 0.1 denotes a highly branched structure.
A decade after the definition of g, Zimm and Kilb introduced another branching ratio based on the intrinsic viscosity:
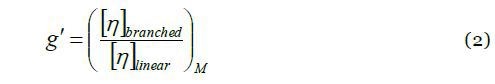
where [η] is the intrinsic viscosity of linear and branched polymer molecules, having the same molar mass. The relationship between g and g’ is elucidated through the ‘draining parameter’ e:

The parameter e is expected to vary in the range of 0.5 - 1.5, while a typical value of e ≈ 0.7 may be utilized for the recalculation of g’ to g.
Equations 1 and 2 demonstrate that, in order to identify and characterize branching, information is needed about the molecular size and molar mass. Multi-angle light scattering (MALS) proves useful for this purpose since it offers both sets of information simultaneously and independently. The MALS detector is normally linked to an analytical separation method, such as size-exclusion chromatography (SEC-MALS) or asymmetric flow field flow fractionation (AF4- or FFF-MALS), to determine branching parameters as a function of molar mass. The parameters of interest include the number of branch units per molecule and the branching ratio.
Because MALS is unable to determine RMS radius for small polymers with R < ~10 nm (corresponding to M ~105 g/mol), an alternative size parameter is required for this class of polymer. Intrinsic viscosity and SEC elution volume are the two most effective alternatives. The former can be utilized to determine g’ by means of Equation 2, while the latter can provide g using the approach of Yu and Rollings:
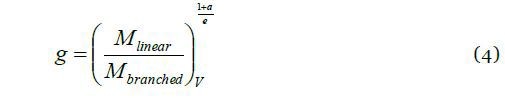
where ‘M’ is the molar mass of branched and linear molecules eluting at the same elution volume V, and ‘a' is the exponent of Mark-Houwink equation for linear polymers.
Methods for Branching Characterization
The characterization of branching by means of SEC or FFF would not be possible without multi-angle light scattering. For the data presented in this note, polymer separation was performed via SEC-MALS or an FFF-MALS. For SEC-MALS, a DAWN® HELEOS® MALS detector, ViscoStarTM differential viscometer, and Optilab® T-rEXTM refractive index detector were used. FFF was performed with an EclipseTM AF4 system in line with a DAWN HELEOS and Optilab T-rEX. Data were collected and processed with ASTRA® software. Analysis of branching ratio as a function of molar mass plots can be obtained by one of the following methods:
Radius Method
The radius method determines g from the conformation plot (log-log plot of R–versus–M) by means of Equation 1. This method is the most direct and fundamentally correct method to characterize branching; however, it is restricted to polymer molecules with RMS radius >10nm.
Mass Method
The mass method determines g from the molar mass–versus–elution volume plot by means of Equation 4. This method is ideal for small polymers for which the RMS radius cannot be determined.
Viscosity Method
The viscosity method calculates g’ from the Mark-Houwink plot (log-log plot of [η]–versus–M) by means of Equation 2. One major advantage of this method is that it has high sensitivity with respect to branching and offers the possibility to measure over a wide range of molar masses down to 1000g/mol. In order to create the Mark-Houwink plot, a differential viscometer is added inline to a SEC MALS setup.
Characterization of Polymer Branching Structures
Figure 1 illustrates an example of the conformation plots of branched and linear polystyrene. One can easily identify branching from the slope of the conformation plot (Figure 1, top): the slopes for all linear polymers in thermodynamically good solvents are ~0.58 whereas lower values are indicative of branching. In this case, the slope of the conformation plot for the linear polymer (blue) is 0.59, and the slope for the branched polymer (red) is 0.48.

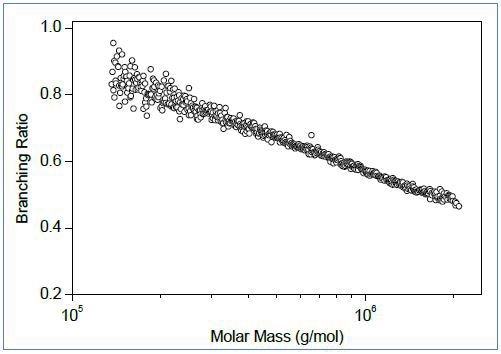
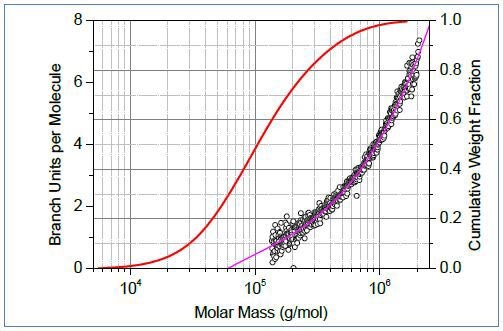
Figure 1. Top: Conformation plots of linear (blue) and branched (red) polystyrene. Center: The corresponding plot of branching ratio versus molar mass. Bottom: The number of branch units per molecule plotted versus molar mass.
The conformation data allow calculation of the branching ratio (Figure 1, center) and number of branch units per molecule (Figure 1, bottom) as a function of molar mass. In order to facilitate quantitative assessment of branching, it is useful to overlay the plot of branching parameter with the cumulative molar mass distibution (Figure1, bottom). For the polystyrene samples in Figure 1, ≈ 28% of molecules have molar mass less than ~60,000g/mol, and these molecules do not have branched units. Remarkably, SEC-MALS is able to detect a single branch unit in polymer chains.
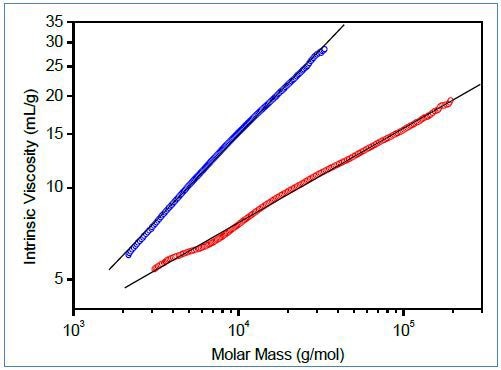
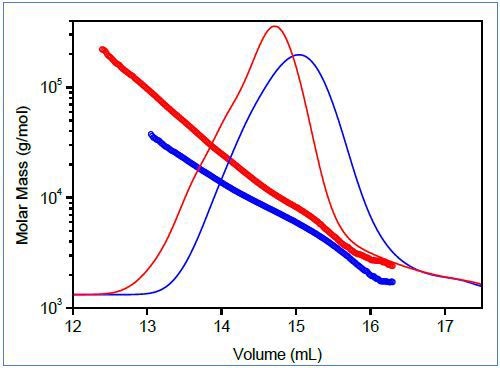
Figure 2. Top: Mark-Houwink plots of linear (blue) and branched (red) poly(lactic acid). Bottom: Molar mass vs. elution volume plots for the same polymers.
Figure 2 shows the characterization of branching for small polymer molecules, comparing molar mass vs. elution volume and Mark-Houwink plots of branched and linear polyesters based on lactic acid. This polymer is bio-compatible and bio-degradable and can be used as a drug delivery material; its capability to swell and release an active compound can be managed by the degree of branching. Both plots indicate the presence of branched molecules and can be utilized to determine g using Equations 2-4.
Size exclusion chromatography may fail for some large, highly branched polymers, whose branches may be temporarily anchored in the pores of SEC column packing. This leads to abnormal elution, wherein larger molecules elute abnormally, at a time which corresponds to a much smaller hydrodynamic volume than actually presented by the molecule. The “upswing” in the conformation plot (Figure 3, red) is characteristic of this abnormal SEC elution
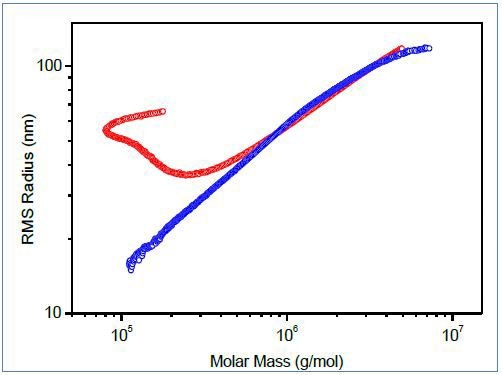
Figure 3. Conformation plots of polymer containing branched macromolecules determined by SEC-MALS (red) and FFF-MALS (blue).
For polymers demonstrating irregular profiles, asymmetric flow field-flow fractionation (AF4 or FFF) is an excellent separation technique and can provide superior conformation plots. Figure 3 depicts the comparison of conformation plots acquired by FFF-MALS and SEC-MALS. The upswing on the conformation plot from SEC-MALS is caused by increased polydispersity of molecules eluting in the area of higher elution volumes. Since separation by FFF is not affected by anchoring of branched molecules in a porous stationary phase, the upswing is completely eliminated.
Conclusion
Multi-angle light scattering allows direct determination of branching ratio (g) and the number of branch units per polymer molecule. For large polymers (R > 10 nm), analysis of SEC-MALS or FFF-MALS using the radius method represents the most direct and fundamentally correct method of branching characterization. Smaller branched polymers may be analyzed by SEC-MALS with an online viscometer to produce Mark-Houwink plots and characterize branching via the viscosity method.
References
- Adapted from "Branching revealed: Characterizing Molecular Structure in Synthetic and Natural Polymers by Multi-Angle Light Scattering," white paper by S. Podzimek. Graphs and illustrations reprinted with permission from Wyatt Technology.
- Polymer Characterization Webinar: Branching revealed: Characterizing Molecular Structure in Synthetic and Natural Polymers by Multi-Angle Light Scattering. Speaker: Dr. Stepan Podzimek.

This information has been sourced, reviewed and adapted from materials provided by Wyatt Technology.
For more information on this source, please visit Wyatt Technology.