The AutoPhaseMap module in AZtecEnergy, the EDS software from Oxford Instruments, detects areas of different characteristic composition from X-ray map data, and measures the composition, constituent elements, and distribution, area of each of these areas or phases.
This article discusses the application of this technique in the determination and characterization of the phases found in an igneous rock.
The AutoPhaseMap method results are then validated by comparing the acquired results with the phase mapping results derived from an EBSD dataset acquired simultaneously with the EDS acquisition.
Experimental Procedure
This analysis used the polished but uncoated samples from an oceanic gabbro. The data acquisition was performed at a high tilt to facilitate concurrent EBSD data acquisition. A variable vacuum was applied to lower charging effects.
An X-ray SmartMap was acquired from an area of the sample. Figure 1 shows the X-ray maps for the key elements detected in the sample.
The element distribution within the sample can be obtained in detail from these maps, which enables predicting the phase and chemical composition of the sample through reconstruction of spectra from representative areas and interpretation of the constituent elements and quantitative results from this data.
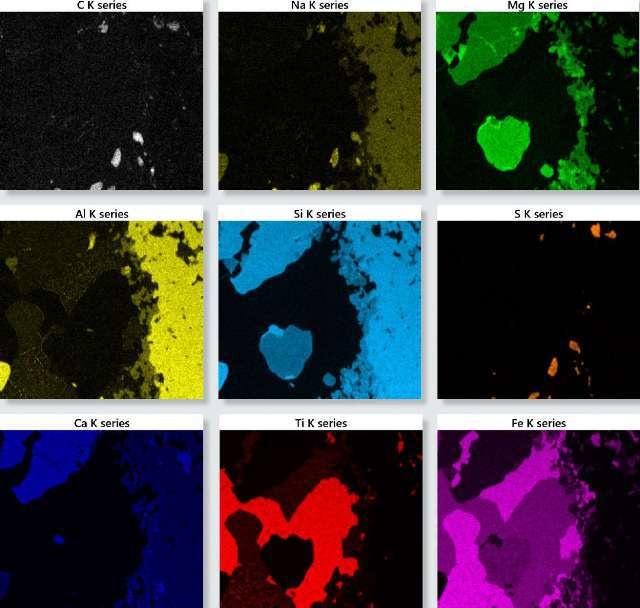
Figure 1. TruMap background and overlap corrected X-ray maps for the oceanic gabbro sample.
Overlaying the X-ray maps to construct a single colored ‘Layered Image’ of the sample, as shown in Figure 2a, facilitates imaging of the sample. This image clearly shows the microstructure and overall phase distribution of the sample.
From the X-ray map data, AutoPhaseMap will find areas of characteristic chemistry and measure their distribution, composition and spectrum within seconds.
These areas of different chemical composition will relate closely to the various phases in the sample. Fig. 2b shows the estimated AutoPhaseMap with a specific number for each phase shown in the color key of the AutoPhaseMap (Figure 2c), providing the area fraction of the identified phase. It is possible to change the phase names. Here, mineral names have been given to each phase based on analysis of the spectra and composition of each phase.
Additionally, for each phase, the AutoPhaseMap software exhibits a phase image delineating the phase distribution; a spectrum estimated by summing the pixels detected corresponding to that phase; and a quantitative result for each phase providing the average phase composition.
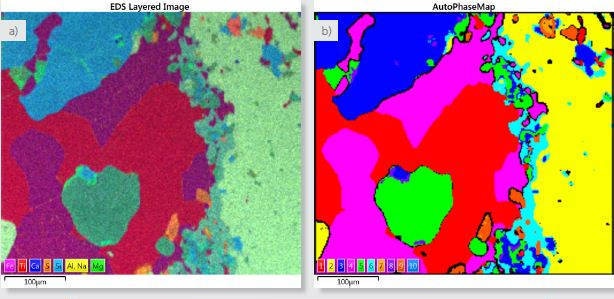
Figure 2. a) Layered image where X-ray maps for Fe (magenta), Ti (red), Ca (blue), S (orange), Si (light blue), Al and Na (both yellow) and Mg (green) have been overlayed. b) AutoPhaseMap composite image showing the distribution of the identified phases. c) Phase details table showing the phases identified and the area fraction of each phase.
| Phase |
Legend |
Fraction (%) |
Pixel Count |
| FeTiO - Ilmenite |
|
22.1 |
13074 |
| SiAlO - Plagioclase |
|
23.6 |
13919 |
| SiCaFeO - Clinopyroxene |
|
13.3 |
7856 |
| FeO - Magnetite |
|
20.2 |
11936 |
| FeSiMgO - Olivine |
|
8.5 |
5014 |
| SiFeO - Amphibole |
|
4.9 |
2876 |
| FeCSO - Iron Sulfide |
|
0.2 |
93 |
| SiMgFeO - Orthopyroxne |
|
0.5 |
291 |
| CFeO - Altered Iron Sulfide |
|
1.3 |
796 |
| CaSiCO - Calcite |
|
0.0 |
18 |
Experimental Results
AutoPhaseMap detected six key phases: two oxides (ilmenite and magnetite) and four silicates (amphibole, olivine, clinopyroxene and plagioclase). The beam skirting due to the variable vacuum leads to some cross talk of the constituent elements, for instance, with Ti, Na, and Al. Reasonable compositions for the minerals are also observed irrespective of the high tilt angle of the sample and the variable vacuum.
AutoPhaseMap also identified a significant number of minor phases as well as phases with Fe and S with varying amounts of sodium, oxygen and carbon. This probably indicates an iron sulphide that has reacted later and changed to other phases. The other phases have been combined together manually to create Phase 9 CFeO, which surrounds the iron sulphide grains and is also occurred in other similar sized grains in the sample, which is in line with high carbon intensities observed in the carbon X-ray Map (Figure 1).
AutoPhaseMap also detected two very small areas of a different carbon comprising phase 10 CaSiCO. If additional contributions for the elements of these nearby minerals are considered, the key constituent elements for this phase will include calcium, oxygen and carbon, indicating a carbonate such as calcite.
Validating AutoPhaseMap Results with EBSD Mapping
EBSD mapping is a proven technique for phase analysis, involving the analysis of the backscattered electron diffraction pattern generated at each pixel location to differentiate the right phase from a set of potential crystal structures. It enables detection of phases much more directly compared to the EDS-based characteristic chemistry by AutoPhaseMap. Figure 3 depicts the comparison of the phase maps produced by the two techniques.
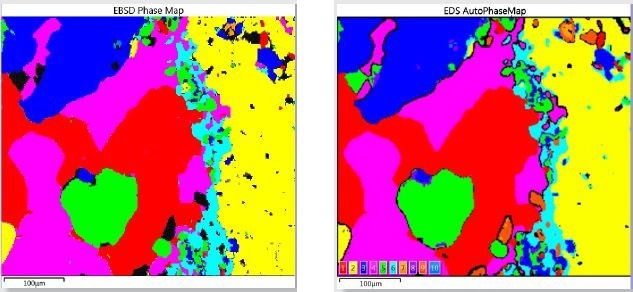
Figure 3. Comparison of Phase Mapping results obtained by EDS and EBSD for the simultaneous acquisition over an area of the oceanic gabbro sample
| EBSD Phase |
Fraction (%) |
Legend |
EDS Phase |
Fraction (%) EDS |
| Ilmenite |
22.5 |
|
1 FeTiO - Ilmenite |
22.1 |
| Plagioclase (Bytownite) |
24.3 |
|
2 SiAlO - Plagioclase |
23.6 |
| Clinopyroxene (Diopside) |
13.2 |
|
3 SiCaFeO - Clinopyroxene |
13.3 |
| Magnetite |
21.7 |
|
4 FeO - Magnetite |
20.2 |
| Olivine (Forsterite) |
7.9 |
|
5 FeSiMgO - Olivine |
8.5 |
| Amphibole (Hornblende) |
5.3 |
|
6 SiFeO - Amphibole |
4.9 |
| Iron Sulfide (Pyrrhotite) |
0.12 |
|
7 FeCSO - Iron sulfide |
0.2 |
| Orthopyroxne (Enstatite) |
0.03 |
|
8 SiMgFeO - Orthopyroxene |
0.12 |
| |
0 |
|
9 CFeO - Altered iron sulfide |
1.3 |
| Calcite |
0.09 |
|
10 CaSiCO - Calcite |
0.03 |
At first look, the results of the two techniques show some similarity, thus validating the results obtained from the AutoPhaseMap method. However, an in-depth analysis reveals the differences and the different strengths of the two techniques. Compared to EBSD, the AutoPhaseMap technique is relatively insensitive to surface preparation, thus providing characteristic chemistry to phases/areas that do not present patterns. EBSD more precisely confirms phase identification. Moreover, the higher spatial resolution of the EBSD method at 20kV provides highly accurate results on finer grains and structures. Data acquisition at higher resolution may improve the EBSD results and especially the EDS.
Conclusion
AutoPhaseMap detects the key phases present in the sample and provides data about phase distribution, composition and constituent elements. Additionally, it yields an extra dimension of data on top of X-ray mapping data in seconds, enabling to gain insights into the history of generation and alteration of a sample. EBSD has been employed to ascertain the AutoPhaseMap results. The comparison shows similar results but differ only in finer details because of the different strengths of the two methods.

This information has been sourced, reviewed and adapted from materials provided by Oxford Instruments NanoAnalysis.
For more information on this source, please visit Oxford Instruments NanoAnalysis.