Thermogravimetric analysis (TGA) is a well-known technique that is used for the characterization of liquid and solid samples. It is widely used for studying pharmaceuticals, petrochemicals and polymers to determine degradation temperatures, monitor solvent and moisture content, and characterize thermal decomposition. Through a highly precise balance, and carefully controlling the heating process, researchers can easily plot mass loss as a function of temperature.

Image Credit: Shutterstock/Avigator Fortuner
Further information related to the composition and thermal behavior of the sample can be acquired by examining the gases that exit the material while it is heated. This enables researchers to ascertain the temperature at which a mass loss transpires and also to determine the molecular structures involved.
Evolved gas analysis (EGA) is normally performed through a range of analytical techniques; however, it is essential to protect the integrity of the gas stream. It must be kept hot and moved swiftly to the gas analyzer to prevent chemical interactions and condensation.
Experimental Setup
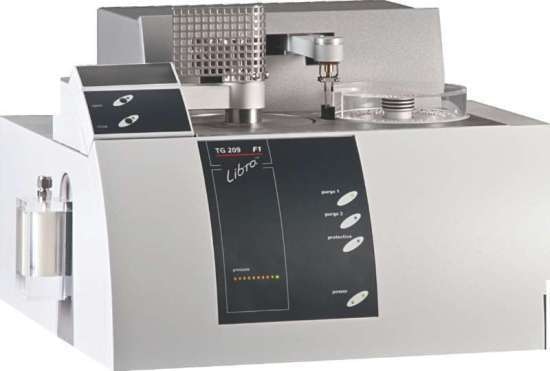
Figure 1. The NETZSCH TG 209 F1 Libra configured with the heated off-gas assembly.
The TG 209 F1 Libra (Figure 1) from Netzsch Instruments is a vacuum-tight TGA that is suitable for linking to a mass spectrometer. Equipped with an automatic sample changer, the Libra measures sample mass to a resolution of 0.1µg and can reach temperatures up to 1100°C.
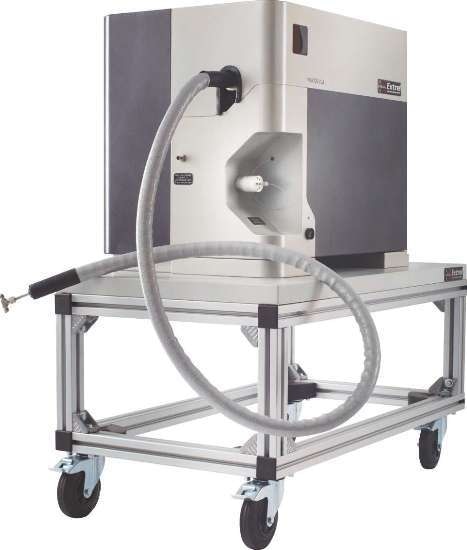
Figure 2. The MAX300-EGA, a quadrupole mass spectrometer optimized for evolved gas analysis.
The heated adapter of the Libra is linked to the transfer line of the Process Insights MAX300-EGA quadrupole mass spectrometer (Figure 2). The interface is differentially pumped for fast clearing and heated up to 200°C to prevent condensation; it offers a chemically-inert and low-volume sample path from the TGA all the way into the ionizer of the mass spectrometer.
The MAX300-EGA is specifically designed for EGA in a laboratory setting and can scan from 1 to 200 amu. It is equipped with the Process Insights 19mm mass filter for long-term stability and high analytical repeatability. In addition, the Questor5 software enables the system to execute qualitative analysis for sample characterization, or perform quantitative analysis, measuring concentrations from 100% down to 10ppb. Besides the transfer line, the MAX300-EGA can also import a start-of-heating signal from the TGA and can be configured to output the data for viewing and manipulation on a different platform if required.
Detection of High-Mass Fragments
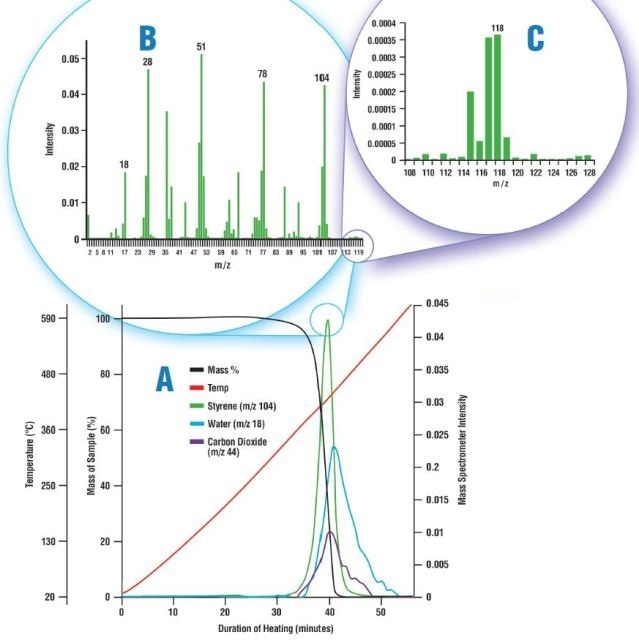
Figure 3. Thermal decomposition of polystyrene. A: Mass loss data from the TGA shown with the intensity trends from the mass spectrometer; B: The mass spectrum of the evolved gas captured at 39.75 minutes; and C: A portion of the mass spectrum, rescaled.
First, the Libra’s furnace was loaded with 0.94mg of polystyrene and heated to more than 600°C. The sample breakdown was monitored to ascertain the sensitivity of the MAX300-EGA to the small signals produced by high-mass hydrocarbons in the off-gas. Even though the TGA records the thermal decomposition of polystyrene as a single weight loss starting at 290°C, the MAX300-EGA demonstrates that the evolution of other compounds has occurred as well (Figure 3. A). Once an evolved sample has left the furnace, it is often difficult to keep larger molecules from dropping out of this sample. On the other hand, the mass spectrum at 39.75 minutes shows, not only the presence of styrene in the off-gas (Figure 3. B), but also the much smaller signal produced by methyl styrene (Figure 3. C).
Quantitation of Evolved Gas
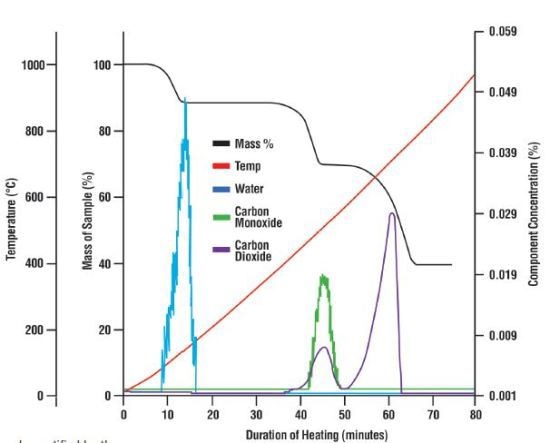
Figure 4. The mass loss of the calcium oxalate sample shown with thermal data and the composition of the off-gas as recorded by the mass spectrometer. Three weight losses occurred during the test which the mass spectrometer was able to identify as water, carbon monoxide and carbon dioxide.
Subsequently, 0.51mg of calcium oxalate was heated in the Libra in order to test the ability of the MAX300-EGA quadrupole mass spectrometer to detect and quantify the compounds in exhaust gas exiting from a µg-level mass loss (Figure 4). The mass of each component in the gas was measured to compare the data from the TGA's balance (Table 1). The MAX300-EGA was able to measure and quantify even the small 60µg loss that occurred as moisture left the sample.
Table 1. The quantitative analysis mode of the MAX300-EGA was utilized to determine the mass of each analyte in the off-gas. These values are shown with the mass loss measured by the TGA.
| MAX300-EGA |
Component |
Mass Loss (ug) |
| 1 |
2 |
3 |
| Water |
60.05 |
– |
– |
| Carbon Monoxide |
– |
60.73 |
– |
| Carbon Dioxide |
– |
34.38 |
149.09 |
| Sum |
60.05 |
95.11 |
149.09 |
| TGA Data |
59.93 |
94.61 |
150.96 |
Moreover, the MAX300-EGA was able to determine the amount of carbon dioxide and carbon monoxide which resulted in the second mass loss. While the breakdown of calcium oxalate was appropriately documented, the capability of the MAX300-EGA mass spectrometer to perform similar quantitative separations can be employed to gain a better understanding of a complex decomposition featuring the concurrent evolution of various unknown compounds.
Additional Applications of MAX300-EGA
The data collected from the effluent of the NETZSCH TG 209 F1 Libra demonstrates that the Process Insights MAX300-EGA is a suitable instrument for EGA. The resolution, sensitivity, and quantitation showed during the tests indicate the potential of the instrument for other evolved gas applications. The MAX300- EGA, in its standard configuration or fitted with the 300 or 400°C transfer line upgrades, may be used to monitor the gas exiting a microreactor, measure solvent loss in a pharmaceutical sample, or detect trace volatile organic compounds (VOCs).
Conclusion
The combination of NETZSCH TG 209 F1 Libra and the Process Insights MAX300 -EGA enables concurrent thermal characterization and quantitative analysis of the compounds in the furnace exhaust.

This information has been sourced, reviewed and adapted from materials provided by Process Insights - Mass Spectrometry.
For more information on this source, please visit Process Insights – Mass Spectrometers.