In protein formulations, native-state unfolding and aggregation is of critical importance to both patients and manufacturers. Product quality and safety concerns need an understanding of aggregation changes as well as careful monitoring for long-term issues that could be directly affected by formulation stability.
Dynamic light scattering (DLS) is a well-known technique used for characterizing the hydrodynamic radius of nano-scale materials in suspension. Raman spectroscopy is another popular technique that provides complete structural information about protein formulations.
Studies combining Raman spectroscopy and DLS are ideal for investigating the phenomenon of aggregation simultaneously with protein unfolding, specifically when these analytical approaches are integrated in a single system. A number of mechanisms have been proposed to describe the behavior of protein formulations as a function of time, normally with incubation at high temperature as a proxy for long-term storage.
This article describes the analysis of time dependence of incubation at increased temperature for a range of BSA formulations of different pH. DLS will be used to monitor the evolution of aggregation, while Raman spectroscopy will be used to track protein unfolding, all in a single experiment.
Methods and Materials
A fiber-coupled Raman spectrometer is integrated into Malvern Panalytical’ Zetasizer Nano(ZSP) to obtain Raman (conformational stability) and DLS (colloidal stability) data in sequence on a single sample. The Zetasizer Nano system integrates non-invasive backscatter (NIBS) detector technology with electrophoretic (ELS), static (SLS) and dynamic (DLS) light scattering in order to determine the hydrodynamic radius of proteins from 0.15 nm to 5 µm, at concentrations ranging from 0.1 mg/mL to >100 mg/mL.
Using 785 nm excitation (~350 mW) from 150 cm-1 to 1925 cm-1 at 4 cm-1 resolution, Raman spectra were collected. Then, BSA samples were prepared at 50 mg/mL concentration in citrate buffer solution at pH 5.4, 7.1 and 4.75 to encompass a range of environments slightly above, significantly above, and close to the isoelectric point, respectively.
Sample aliquots (~120 µL) were then placed within a 3 mm quartz cuvette and positioned in a compartment which offers temperature control from 0°C to 90°C ± 0.1°C.
Results and Discussion
DLS and Raman Spectroscopy Data
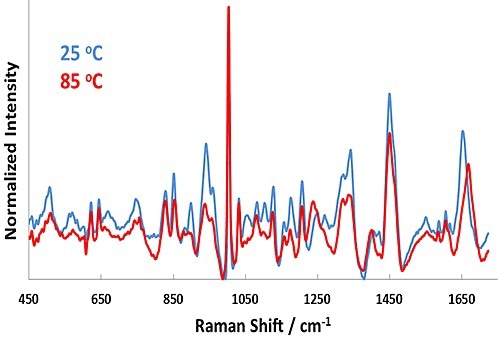
Figure 1. Representative Raman spectra for BSA in pH 7.1 formulation at 25°C (blue line) and 85°C (red line).
Representative Raman spectra for the pH 7.1 sample at 25°C and 85°C are shown in Figure 1. In the Raman spectra, significant changes occur upon heating from 25°C to 85°C, such as in the Amide I (~1650cm-1) and Amide III (~1250cm-1) bands.
These features point to secondary structural changes in BSA and confirms unfolding of the protein as the temperature is increased. Similarly, the size data shows a strong shift from ~7 nm (25°C) to 35 nm (85°C) as a function of temperature. This result indicates considerable aggregation of the protein at 55°C.
Determination of the transition temperature
Incubation below the transition temperature (Tt) is utilized in order to determine a non-equilibrium state where aggregation is desired and the process can be tracked in real-time. A range of temperature ramping experiments was performed to establish the Tt at the pH of interest. The resultant Raman and DLS transition curves were accommodated for each formulation to ascertain their corresponding Tt values. The results of the transitions for each formulation are shown in Figure 2.
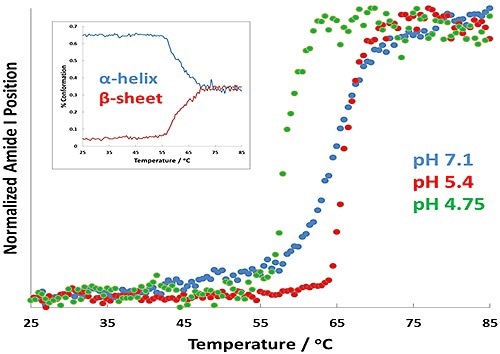
Figure 2. Protein transition curves as a function of temperature for formulations at pH 7.1 (blue), pH 5.4 (red), and pH 4.7 (green). The α-helix to β-sheet conversion is shown as an inset for the pH 4.7 results.
In Figure 2, the results show changes in Tt as a virtue of pH. Of greatest importance is the change in transition temperature between the different samples: the pH 4.7 displays the lowest Tt, while the pH 5.4 sample shows the highest. A full spectral range PLS prediction for the pH 4.7 sample is shown by the inset plot displays.
This plot also predicts the amount of α-helix and β-sheet structure in the BSA as a virtue of temperature. The amount of α-helix appears to decrease quickly as the transition temperature of BSA is attained, denoting that the BSA is unfolding.
Results for both size-derived Tt and Tt determined from the Amide I and Amide III spectral regions are shown in Table 1.
Table 1. Transition temperatures (Tt) derived from DLS size data (Z- Average) and Raman spectral analysis for various BSA formulations.
| BSA |
Size (nm) |
Amide I (°C) |
Amide III (°C) |
| pH 7.1 |
64.5 |
64.8 |
64.6 |
| pH 5.4 |
64.4 |
66.1 |
66.6 |
| pH 4.7 |
56.5 |
59.6 |
59.6 |
Thus, depending on solution pH, Tt for BSA varies from 59°C to 65°C.
BSA Aggregation Kinetics
Based on the results shown in Table 1, 60°C is indicated as a starting point to inspect the aggregation kinetics of these BSA formulations. Each formulation was then incubated at 60°C, with Raman and DLS data being collected successively every 5 minutes. The experiment performed at 60°C for BSA at pH 4.7 displayed rapid precipitation of 'flaky' white material; under these conditions BSA aggregation was faster than could be measured. The DLS data and Raman spectral data collected for the pH 5.4 and 7.1 formulations at 60°C is summarized in Figure 3.
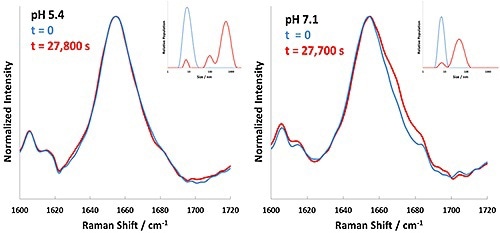
Figure 3. Background corrected Raman spectral data (Amide I band) and DLS results for BSA formulations at pH 5.4 and 7.1 incubated at 60°C. Time zero is represented in blue, and completion of incubation in red.
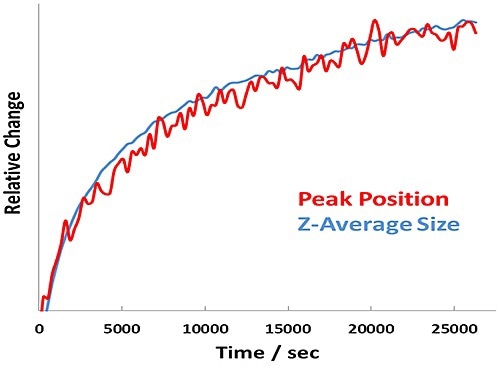
Figure 4. Relative change in Amide I peak position and Z-Average size versus time for BSA at pH 7.1 - 7.7 hour incubation at 60°C.
In addition, the size and unfolding kinetics closely track one another for the pH 7.1 sample (Figure 4), revealing that protein unfolding and aggregation are simultaneous at a point far from the pI.
Thus, unique behavior is observed for the two samples quantified below the transition temperature. At pH 7.1, far from the pI, the unfolding of the protein is tracked by the Z-average size of the BSA. This indicates that the protein is unfolding to very large sizes, but is not aggregating substantially. At pH 5.4, close to the pI, the protein is aggregating to very large sizes but not unfolding.
Conclusion
The combination of Raman spectroscopy and DLS offers the ability to quantify changes in size simultaneously with changes in molecular structure. The combined approach describes both protein unfolding kinetics and aggregation behavior in a single experiment, leading to an enhanced understanding of the interplay between these two processes.

This information has been sourced, reviewed and adapted from materials provided by Malvern Panalytical.
For more information on this source, please visit Malvern Panalytical.