An instrument which combines Raman spectroscopy with dynamic light scattering (DLS) can be used to study lysozyme’s unfolding and refolding processes under thermal stress conditions. Through the combination of these complementary techniques, secondary and tertiary protein structural markers (Raman spectroscopy) along with size changes (DLS) can be utilized in order to gain a better understanding of the unfolding behavior of lysozyme and other proteins.
In these experimental studies, attention is paid to the skeletal (930 cm-1 - 950 cm- 1), amide I (1600 cm-1 - 1700 cm-1), and amide III (1200 cm-1 - 1300 cm-1) marker regions in the Raman spectra. Variations in these areas suggest changes in protein’s secondary structure. Moreover, changes in tertiary structure can be seen by analyzing tyrosine (850 cm-1) and tryptophan (1550 cm-1) bands in the Raman spectra. Changes in these regions indicate a change in the local hydrophobic or hydrophilic environment of the side chain, which is typical of unfolding. The DLS measurements are used in order to analyze the size changes of the thermally stressed lysozyme in solution.
As the protein heats and starts to aggregate and unfold, it becomes larger. This increase in size as well as the changes in the protein structural markers in the Raman data, describes the lysozyme’s unfolding behavior.
Methods and Materials
A fiber-coupled Raman spectrometer with a Zetasizer Nano ZSP is integrated within Malvern Panalytical’ Zetasizer Helix (ZS Helix) to provide Raman (conformational stability) and DLS (colloidal stability) data in sequence on a single sample.
The Zetasizer Nano system combines non-invasive backscatter (NIBS) detector technology with electrophoretic (ELS), static (SLS) and dynamic (DLS) light scattering to quantify the hydrodynamic radius of proteins from 0.3 nm to 10 µm, at concentrations from 0.1 mg/mL to 100 mg/mL, or more. Raman spectra were then collected using 785 nm excitation (~280 mW) from 150 cm-1 to 1925 cm-1 at 4 cm-1 resolution.
Lysozyme from the white of a chicken egg was formulated at concentrations of 3mg/mL and 30 mg/mL in a pH 4 citric acid buffer. Next, sample aliquots (~120µL) were introduced into the sample compartment by means of a quartz cuvette with a 3 mm pathlength. The temperature of the sample compartment can be set from 0 °C to 90°C ± 0.1°C.
Thermal jump experiments were carried out by taking a Raman spectrum and DLS measurement at a low temperature, rapidly increasing the temperature in the sample compartment to a high temperature, conducting another Raman and DLS measurement, and then returning the temperature in the compartment to the initial low temperature, before performing another Raman and DLS measurement. Thermal ramp studies were carried out collecting DLS and Raman data at a range of pre-defined 0.1°C to 2°C step-wise temperature increments.
Results and Discussion
Temperature Jump Studies
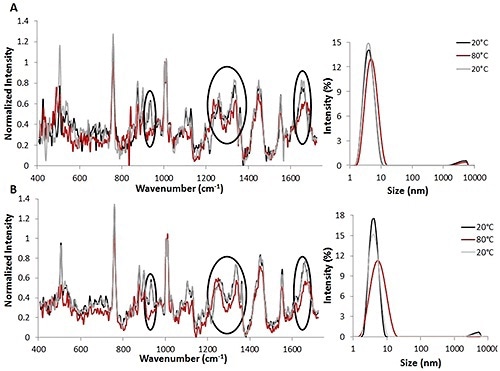
Figure 1. Raman spectra (left) and DLS size data (right) for temperature jump studies using 3 mg/mL (A) and 30 mg/mL (B) lysozyme solutions. All spectral data is background corrected and normalized to the height of the Phe peak.
Temperature jump studies were initially used to study the reversibility of lysozyme unfolding induced by thermal stress (Figure 1). The combination of Raman and DLS data obtained from the thermal jump experiments indicates that lysozyme unfolding occurred and that these changes are probably reversible.
Both sets of parameters studied suggest that when the temperature is increased from 20°C (indicated by the black line) to 80°C (indicated by the red line), variations are seen in the structure of protein for 3mg/mL (Figure 1A, left) as well as 30 mg/mL (Figure 1B, left) solutions.
The Raman spectra revealed changes in both secondary and tertiary structural markers during heating. Upon reversing the temperature to 20°C (indicated by the gray line), the changes are also reversed. This suggests that structural changes can be reversed once the temperature is decreased.
Likewise, the DLS data obtained with Raman data from the lysozyme solutions demonstrate that when the temperature is raised from 20°C to 80°C, the protein’s size increases from ~4 nm to ~5 nm for the 3 mg/mL lysozyme solution (Figure 1A, right) and from ~4 nm to ~7 nm for the 30 mg/mL lysozyme solution (Figure 1B, right).
As predicted, the size changes are larger for the higher concentration lysozyme solution. These size changes suggest that the protein is starting to unfold at the higher temperature. However, complete denaturation is not taking place, as this may lead to agglomeration.
For further analysis of the size and structural changes that lysozyme undergoes while subjected to thermal stress, temperature ramping studies were carried out.
Temperature Ramp Studies
Temperature ramp studies were carried out by collecting Raman and DLS data at each 1°C increment between 20°C and 80°C, and repeating between 80°C and 20°C. The DLS and Raman spectral data from the thermal ramping studies suggest that as the temperature increases, there are size changes (Figure 2B) as well as secondary and tertiary structural changes (Figure 2A) in the lysozyme in solution.
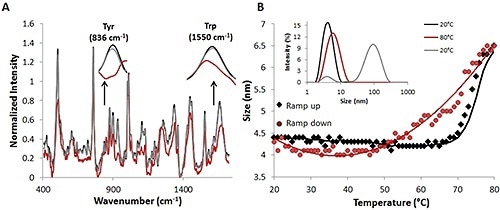
Figure 2. Raman and DLS data from a complete temperature ramp cycle with 30 mg/mL lysozyme sample.
After the temperature is decreased to the original temperature of 20°C (red circles), the size also goes back to the original size of ~4.5nm (Figure 2B). Further substantiation of this reversibility is provided by comparing the percent intensity distributions at 20°C (black line), 20°C (gray line) (Fig. 2B, inset), and 80°C (red line).
The Raman spectral data, together with the DLS data from the thermal ramping study, again indicate that size and structural changes occur at higher temperatures and these size and structural changes are reversible.
Conclusion
Combining DLS and Raman spectroscopy into a single instrument is effective in studying the reversibility of the unfolding process in lysozyme while subjected to temperature changes at pH 4. The Raman and DLS results indicate that lysozyme was starting the unfolding process when the temperature was increased, as DLS data demonstrated that there was an increase in protein size, while Raman spectral data indicated that secondary and tertiary structural markers changed.
When the temperature was reduced to the starting temperature of 20°C, the spectral and size data indicated that the variations observed at the higher temperature were reversed, suggesting that any unfolding that occurred was reversible. The concurrent monitoring of two protein characteristics, their structure and size, during thermal stress provided a more comprehensive picture of the protein behavior during this study.

This information has been sourced, reviewed and adapted from materials provided by Malvern Panalytical.
For more information on this source, please visit Malvern Panalytical.