In the development of biopharmaceutical products, the characterization of thermal stability is a critical step for optimizing monoclonal antibodies (mAbs) and their formulations. A standard technique used to characterize thermal behavior is known as Differential Scanning Calorimetry (DSC). This technique provides an endotherm from which stability and thermodynamic properties can be derived.
In order to reduce aggregation during heating, DSC samples are typically run at low concentrations and hence this technique is not effective for testing the stability of higher concentrations that are a characteristic of formulated products. It is assumed that aggregation does not occur as a result of heating these low concentration samples; however, there is no means to substantiate this from the acquired data, and samples with visual signs of aggregation are usually the end product of a DSC run.
The combination of Raman spectroscopy and dynamic light scattering (DLS) enables the analysis of thermal stability at formulation concentrations and helps distinguish unfolding from aggregation events.
The secondary structure in mAbs is quite stable as the structural framework is rich in p-sheet, with covalent disulfide bonds rendering further stability. As a result, thermal stress alone is not sufficient to disturb the secondary structure. This article compares the thermal stability of a modified monoclonal antibody (mmAb) and the related template monoclonal antibody (mAb) upon which the modification has been carried out.
Methods and Materials
The Zetasizer Helix (ZS Helix) from Malvern Panalytical incorporates a fiber-coupled Raman spectrometer with a Zetasizer Nano ZSP to provide Raman (conformational stability) and DLS (colloidal stability) data in sequence on a single sample. The Zetasizer Nano system integrates non-invasive backscatter (NIBS) detector technology with electrophoretic (ELS), static (SLS) and dynamic (DLS) light scattering in order to determine the proteins’ hydrodynamic radius from 0.15 nm to 5 µm, from 0.1 mg/mL to greater than 100 mg/mL. Using 785 nm excitation (~280 mW) from 150 cm-1to 1925 cm-1 at 4 cm-1 resolution, Raman spectra are collected.
The mAb and mmAb were prepared at 50 mg/mL in 10 mM His buffer at pH 5.5. The samples were maintained at 4°C until the studies were carried out. Sample aliquots (~120µL) were then introduced into a 3 mm quartz cuvette and placed in a compartment that provides temperature control from 0°C to 90°C ± 0.1°C.
Thermal ramp studies were then performed by acquiring DLS and Raman data over a set of pre-defined 0.1°C - 5°C step-wise increments. Next, isothermal incubation studies were performed by acquiring a set of DLS and Raman data over a predefined time interval at the preferred temperature set-point.
Results and Discussion
Raman Spectroscopy
After heating the mAb and mmAb samples, their size and structural characteristics were monitored via Raman and DLS throughout the experiment. Figure 1 shows the Raman spectra of the mAb and mmAb samples at high and low temperature, and confirms the stability of the molecules’ secondary structure. Spectral regions related to these conformations, particularly the Amide I and III regions, do not display considerable peak shift or changes but so show a slight band broadening in the Amide I region.
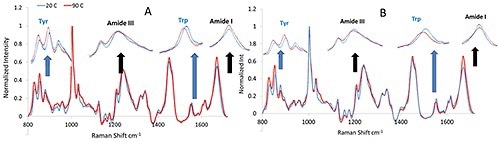
Figure 1. Representative Raman spectra for monoclonal antibody (A) and its modified version (B) before and after thermal stress.
The mAb/mmAb's secondary structure can be modeled with a Partial Least Squares analysis in which spectra acquired from reference protein samples with known secondary structural elements are used in order to predict the secondary structure of unknown protein samples.
Figure 2 illustrates the temperature dependence of the four structural motifs predicted by the model: p-sheet, p-turn, a-helix and random coil for the mAb (Figure 1A) and mmAb (Figure 1B). Despite the small spectral and structural changes observed, it is possible to see that the mmAb and mAb exhibit different behaviors (Figure 2).
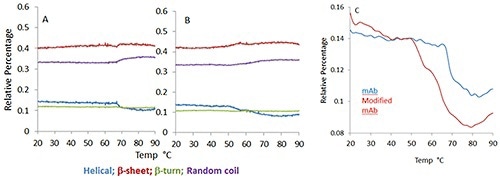
Figure 2. Predicted secondary structure percentage for monoclonal antibody (A) and its modified version (B) as a function of increasing temperature. Different color traces show the change in different structural elements.
In Figure 2C, the mmAb displays a lower onset temperature with a double transition at ~50°C and 65°C, respectively, whilst the mAb shows a single abrupt transition close to 70°C. This suggests that the mmAb and mAb respond differently to thermal stress, although this was not evident in a direct comparison of the spectra.
Interestingly, tyrosine and tryptophan show considerable differences between mAb and mmAb. As illustrated in Figure 3A, the spectral marker indicative of the dihedral angle between the peptide bond plane of the tryptophan side chain and the indole ring display a sharp transition for the mAb at ~69°C. However the mmAb has an earlier onset at ~66°C and its transition is very broad.
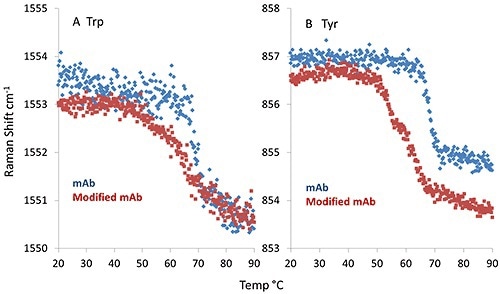
Figure 3. The fitted peak position of the spectral marker indicative of the dihedral angle between the indole ring and peptide bond plane of a tryptophan side chain (A); spectral marker describing the Hbonding environment of a tyrosine side chain (B).
Additional differences are observed in Figure 3B, in which the spectral marker describing the hydrogen bonding environment of the tyrosine side chain is plotted. The mAb again shows a sharp transition at ~69 °C.
However, the mmAb trace displays a double transition, with inflection points at ~53°C and ~62°C. This observation, together with the conformational stability observed in the secondary structure, indicates that the tyrosine side chain may cause an early conformational change leading to lower thermal stability.
Dynamic Light Scattering
Although Raman spectroscopy provides insights into structural changes, it does not address size changes caused by aggregation and unfolding during thermal stress. The combined method of Raman and DLS helps to study both of these important characteristics at the same time.
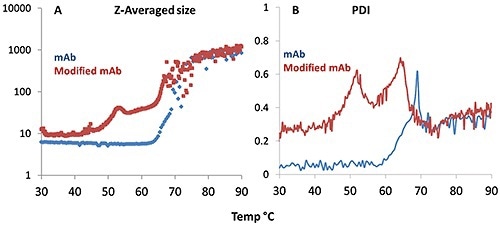
Figure 4. Z-average size (A) and polydispersity index, PDI (B) derived from dynamic light scattering (DLS) plotted for the monoclonal antibody (blue trace) and its modified version (red trace) as a function of temperature.
Figure 4A shows that the onset of aggregation for the mAb takes place at a higher temperature when compared to the mmAb, again indicating its high thermal stability. The mmAb displays the same double transition as observed in the Raman data, particularly for the tyrosine H-bonding environment.
The DLS Z-average size data reveals that the lower temperature transition is an oligomerization event at ~50°C, while the higher temperature transition for the mmAb (~65°C) is a rapid aggregation event, as observed in the mAb sample >70°C.
In Figure 4B, the PDI trend is consistent. For the mAb sample, the PDI varies about 0.1 until a single, a major increase is observed at ~60°C. This indicates that the mmAb samples form oligomers during the initial transition, and these oligomers in turn form the large aggregates specified in the second transition. These observations are consistent with the Raman data described above.
The DLS technique not only determines the size itself but also determines the size distribution, which is not possible with turbidity measurements or static light scattering.
Isothermal Incubation
The aforementioned results indicate that the variations in the thermal stability profiles of the mmAb and mAb are due to oligomerization of mmAb caused by the unfolding of tertiary structure. However, the kinetics of this process and the stability of the oligomers are still not clear. For this purpose, isothermal incubations at pre- transition (46°C), in-transition (53°C) and post transition (60°C) temperatures were performed. The results are shown in Figure 5.
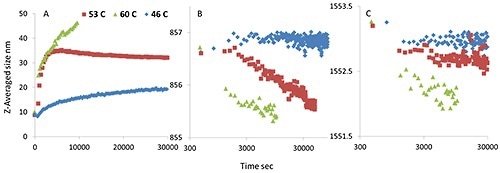
Figure 5. An isothermal incubation study for mmAb, Z-averaged size derived from DLS data (A); tyrosine peak position (B); and tryptophan peak position (C). The different incubation temperatures are presented as blue (46°C), red (53°C ), and green traces (60°C), plotted as a function of time.
The size gradually increases when incubated at the pre-transition temperature; the tryptophan and tyrosine Raman maker bands do not show any considerable peak shifts. However, at 53°C, the size rapidly increases from 10 nm to ~35 nm and then stabilizes. At the same time, the tyrosine peak position drops, whilst the tryptophan peak position moves slightly.
These observations again support the idea that the modified or newly added tyrosine residues cause oligomerization at lower temperatures, which eventually leads to a lower thermal stability for the mmAb.
Conclusion
The combination of DLS and Raman spectroscopy clearly shows that the tested mAbs exhibit different secondary structure transition profiles when compared to model globular proteins. The aromatic side chain residues in the mAbs reveal clear structural and conformational transitions with thermal stress and the modified mAb’s thermal stability is lower than the mAb. In addition, the mechanism of oligomerization seems to be triggered by a structural change in the tyrosine side chain and the oligomers formed are stable and do not dissociate as a result of cooling.

This information has been sourced, reviewed and adapted from materials provided by Malvern Panalytical.
For more information on this source, please visit Malvern Panalytical.