The combination of Raman spectroscopy and dynamic light scattering (DLS) provides significant information about physical, chemical and structural parameters from proteins at both low and high concentrations. Raman, which is used to determine protein conformation, and DLS, which is used to study protein size, is integrated into a single system to monitor stressed protein samples under similar conditions.
Raman spectroscopy is suitable for deriving secondary and tertiary structural markers from higher concentration protein samples, while DLS is perfect for determining the size of proteins at low concentrations. These combined analytical techniques can be used to study the lowest concentration of a protein.
Since DLS is ideally suited for analyzing low concentration samples, this article describes the lowest protein concentration limit for collecting Raman spectra, and explores the ability of a DLS/Raman instrument to study different concentrations of protein samples. Since the analytical techniques have differing concentrations, it is necessary to establish the lower and upper practical concentration boundaries for a protein sample.
Methods and Materials
The Zetasizer Helix (ZS Helix) from Malvern Panalytical combines a fiber-coupled Raman spectrometer with a Zetasizer Nano ZSP to provide Raman (conformational stability) and DLS (colloidal stability) data in sequence on a single sample.
The Zetasizer Nano system combines non-invasive backscatter (NIBS) detector technology with electrophoretic (ELS), static (SLS) and dynamic (DLS) light scattering in order to determine the proteins’ hydrodynamic radius from 0.15 nm to 5 µm, from 0.1 mg/mL to > 100 mg/mL.
Using 785 nm excitation (~280 mW) from 150 cm-1 - 1925 cm-1 at 4 cm-1 resolution, Raman spectra are collected. Sample aliquots (~120 µL) are then introduced into a 3 mm quartz cuvette and placed in a compartment that provides temperature control from 0°C to 90°C ± 0.1°C.
Thermal ramp studies are then carried out by collecting DLS and Raman data over a range of pre-defined 0.1°C - 5°C step-wise increments. Isothermal incubation studies are also performed by collecting a set of DLS and Raman data over a pre-defined time interval at a preferred temperature point.
Conditions for Raman spectral data collection are optimized for protein samples of low concentration to determine a practical detection limit for obtaining Raman spectra for protein therapeutics. Two samples, mAb and lysozyme, are analyzed at various concentrations.
Secondary structural markers, such as amide I (1600 cm-1- 1700 cm-1) and amide III (1200 cm-1 - 1350 cm-1), and tertiary structural -1 -1 markers, such as tyrosine at ~830 cm-1 and tryptophan at ~1550 cm-1 are observed during thermal ramp experiments. Modifications in these markers indicate a change in the protein structure during heating. This provides the ability to detect any changes, which is important when analyzing protein structure.
Results and Discussion
This article focuses on determining the lowest concentration limit for studying proteins with a combined DLS/Raman instrument. Since DLS is suitable for lower concentration samples, most of the effort is made in optimizing the Raman acquisition parameters. In order to increase the Raman signal from lower concentration samples having less Raman scattering particles, it is practical to increase the integration time and also increase the number of co-additions of multiple scans.
To keep experiment times practical, all acquisition times are sustained at or below 30 minutes for both the mAb and lysozyme concentration samples. Samples with higher concentration are used in order to establish the predicted changes in the protein structure. Table 1 shows a summary of the acquisition parameters used when acquiring mAb and lysozyme data.
Table 1. Data acquisition parameters for lysozyme and mAb samples at a single temperature increment.
| Sample |
Integration time (s) |
Co-adds (#) |
Raman acquisition time (s)/T |
Total acquisition time (min)/T |
| 35 mg/mL lysozyme |
15 |
10 |
150 |
5.5 |
| 12 mg/mL lysozyme |
30 |
10 |
300 |
8 |
| 3 mg/mL lysozyme |
40 |
40 |
1600 |
30 |
| 50 mg/mL mAb |
20 |
10 |
200 |
6 |
| 10 mg/mL mAb |
20 |
10 |
200 |
6 |
| 5 mg/mL mAb |
25 |
40 |
1000 |
20 |
Lysozyme
Thermal ramping experiments are carried out to evaluate 3mg/mL, 12mg/mL, and 35mg/mL lysozyme samples in citrate buffer at pH 4. The sample with the highest concentration is used as a point of reference for the comparison of a low concentration sample.
Spectra of a 35mg/mL lysozyme solution at 25°C (indicated by the light red trace) and 90°C (indicated by the dark red trace) are included (Figure 1A). Specific protein markers of interest are highlighted, representing the changes in the secondary and tertiary structure at the time of the temperature ramp experiment. The changes are obvious in the a-helix skeletal (930 cm-1 - 950 cm-1), amide I (~1600 cm-1- 1700 cm-1), amide III (~1200 cm-1 - 1350 cm-1), and tryptophan at 760 cm-1.
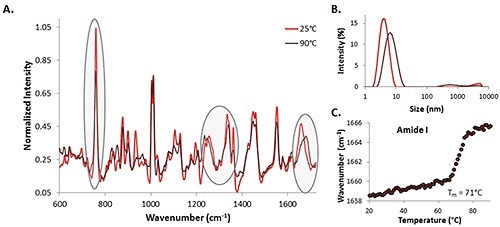
Figure 1. A comparison of 35mg/mL lysozyme spectra at 25°C (red line) and 90°C (dark line) (A), size data at the same temperatures (B), and the amide I peak shift with temperature (C).
DLS size data is also considered for the high concentration lysozyme sample (Figure 1B). As anticipated, as the temperature increases, the size of the lysozyme also increases. This demonstrates that protein unfolding (and probably aggregation) is occurring as the temperature increases, which corresponds with the spectral data indicating that protein structure is changing as the temperature rises.
In addition, the center of mass (COM) shift with temperature for the amide I peak is also included, as shown in Figure 1C. As the temperature rises, the COM shifts to higher wavenumbers, implying that the structure is transforming from a-helix to P-sheet rich as the temperature rises. At this high concentration, the Raman data can be utilized for both protein detection and characterization, and transition data can be obtained. This information is used as a comparison for the lower concentration data.
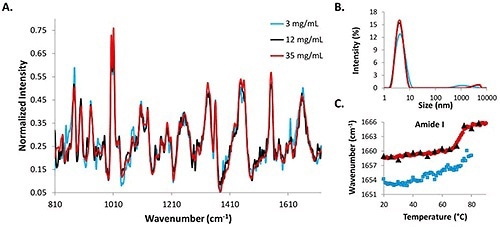
Figure 2. Structural and size data from 3mg/mL, 12mg/mL, and 35mg/mL lysozyme in pH 4 citrate buffer solutions.
DLS intensity distributions, Raman spectra, and amide I COM shifts for low (3mg/mL), medium (12mg/mL) and high (35mg/mL) lysozyme concentrations are shown in Figure 2. The Raman data from the 3mg/mL concentration lysozyme sample (represented by blue line) is the most noisy, while the Raman spectrum for the 35mg/mL (represented by red line) is the least noisy, and the 12mg/mL sample (represented by black line) falls in the middle of the two (Figure 2A).
Intensity distributions from the DLS data suggest that the protein molecules in solution are all ~4nm at 25°C (Figure 2B). The similarity between the spectral data and the size data at the starting temperatures for all three concentrations shows that combination of DLS/Raman can be used for lysozyme detection at concentrations as low as 3mg/mL. The COM shift for the amide I peak is included for all concentrations (Figure 2C).
Further comparisons between the low concentration and high concentration samples are made by means of a PLS model to ascertain the secondary structural composition of five concentrations of lysozyme (Figure 3).
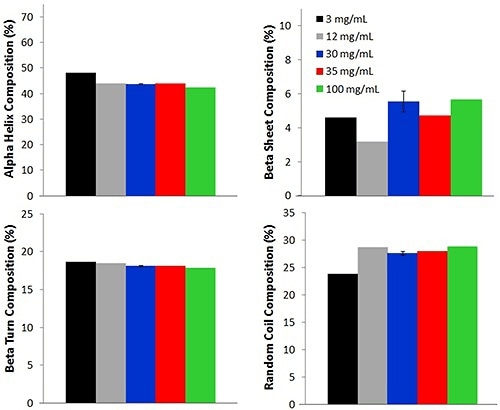
Figure 3. Secondary structure PLS model used to determine alpha helix, beta sheet, beta turn, and random coil compositions from samples of various lysozyme concentrations at 25°C (12 mg/mL values are reported at 30°C).
For each lysozyme sample, four different secondary structure compositions such as alpha helix, beta turn, beta sheet and random coil are predicted. The percentage of alpha helix is the highest, with an average percentage of 44.0% ± 2.0%. This value is consistent with literature reports of lysozyme solutions at pH values near 4.
While a slight small difference is seen between multiple concentrations, the values are similar across the concentrations, again demonstrating that the Raman data acquired from samples with low concentration is an excellent representation of the lysozyme.
Monoclonal Antibody
Similar to lysozyme, low concentration (5mg/mL), medium concentration (10mg/mL), and high concentration (50mg/mL) samples of a mAb were analyzed using the DLS/Raman technique. Thermal ramping experiments were then carried out from 25°C to 90°C with 0.2°C to 0.5°C steps for all concentrations.
For the high concentration sample, the Raman collection time was ~ 3.3 minutes per temperature increment. This collection time resulted in the Raman spectrum having a high signal to noise ratio. Figure 3 shows the Raman spectra at 30°C and 80°C. Upon analysis, it is clear that tertiary structural changes are taking place when the protein solution is under thermal stress.
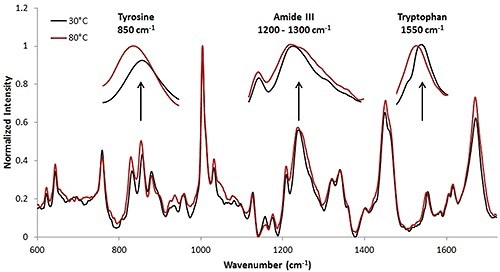
Figure 4. Spectra of high concentration mAb (50mg/mL data). Thermal transitions are less obvious than with the lysozyme sample (Figure 1); however changes in the secondary and tertiary structural markers are visible at the high concentration.
Figure 4 shows spectra from 5mg/mL (blue), 10mg/mL (black line), and 50mg/mL (red line) mAb samples at 25°C. The data from the highest concentration and the lowest concentration samples results in the least and most noisy spectra, respectively.
Based on the data acquired from the mAb sample at different concentrations, concentrations as low as 5mg/mL can be used for sample detection. However, in order to elucidate thermal transitions, concentrations have to be as high as 10mg/mL.
Conclusion
The combination of complementary techniques, DLS/Raman, can be effectively used to describe the protein size (DLS) and conformation (Raman) changes when exposed to stressors. The lower concentration limit for Raman detection has been assessed by conducting thermal ramping experiments. Lysozyme at concentrations down to 3mg/mL can be analyzed, along with the identification of secondary and tertiary structural markers.
On the other hand, monoclonal antibodies are likely to have only tertiary structural changes. Thus, the integration of DLS and Raman spectroscopy can provide unique insights into the protein unfolding and aggregation pathways at both high and low concentrations.

This information has been sourced, reviewed and adapted from materials provided by Malvern Panalytical.
For more information on this source, please visit Malvern Panalytical.