Mammalian cell cultures involve growth of cells in controlled environment. They are complex processes and are essential for production of biologic products such as viral vaccines. This article discuses the development and use of new bioprocess analytics as per the objectives of the Process Analytical Technology (PAT) initiative of the US FDA and “Quality by Design” (QbD).
Advantages of Raman Spectroscopy
Using Raman spectroscopy, bioprocesses can be in situ monitored and controlled rapidly and in real time, making the technique suitable for QbD and PAT applications. It is essential to have the ability of quantitative analysis of components of a complex system such as bioprocess cell cultures with no interference from other elements in the system.
Vibrational spectroscopic technologies such as NIR and Raman spectroscopy generate typical “fingerprint” like spectra of biological and organic molecules, thereby enabling the selection of particular peaks for quantitative analysis. In addition, they are compatible to non-contact or immersion sampling optics, and collect data within seconds with little or no sample preparation.
However, the interference of water in NIR spectra of aqueous-based systems like mammalian cell cultures is very high compared to Raman spectra (Figure 1). This is due the very weak Raman profile of water. Hence, Raman systems are more suitable for analysis of bioprocesses.
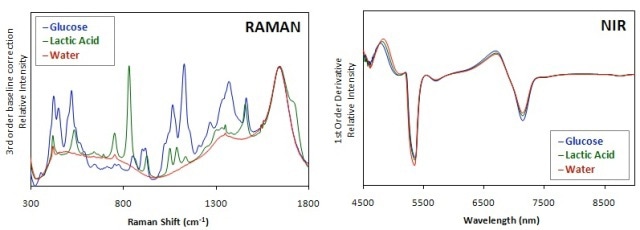
Figure 1. Comparison of Raman and NIR spectra of glucose and lactic acid in water. Raman spectra were processed using a 3rd order baseline correction and a 1st order derivative was applied to NIR spectra.
Experimental Procedure
The spectroscopic specificity of the components of CHO cell culture was analyzed in this experiment. Glutamine, lactic acid, and glucose samples were made to concentrations present in mammalian cell cultures. A RamanRxn2™ analyzer coupled with a 457mm in situ probe and a 785-nm Invictus™ laser was used to analyze the samples. A 2-L autoclavable glass bioreactor was used to conduct four CHO cell culture batches (Batches 1–4).
Spinner flasks were used to grow the seed cultures and the inoculation of the bioreactor was at a cell density of 2 x 10⁵ cells/mL. All control factors and practices used simulated industrial fed-batch CHO cell culture processes. For each batch, grab samples were extracted from the bioreactor roughly two times a day and studied off-line with the help of a BioProfile® Basic 100 automated analyzer.
The Raman probe was directly placed into the bioreactor through the headplate and continuously collected Raman spectra for every 20 minutes using an exposure time of 30s with 40 accumulations until the completion of the run.
Experimental Results
Several different analytical techniques were used to analyze the in-line Raman data. Relative concentration changes of glucose were observed over batch time using the simplest Raman peak area trending. The next step was the creation of a quantitative univariate model for glucose concentration through correlation of the offline reference data with the baseline integrated areas under the glucose peak at 1135 cm–1. Off-line samples were then matched to spectra acquired just before and after the removal of samples from the bioreactor.
The univariate calibration model was created using data from Batches 1–3. The final step is the creation of partial least squares (PLS) multivariate calibration models for glutamine, lactate, and glucose utilizing a multivariate data analysis package (GRAMS PLSplus/IQ™).
The correlation of reference measurements acquired during the course of Batches 1–3 for each species to larger areas of the Raman spectra was conducted using PLS (one model per constituent). Using univariate and PLS models, Batch 4 (validation batch) concentrations were then predicted (Figures 2 and 2 and Table 1).
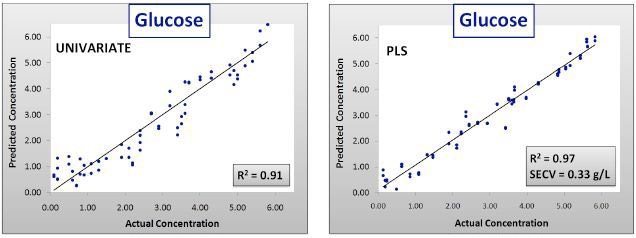
Figure 2. Calibration results for univariate and PLS glucose models. SECV = Standard error of cross validation.
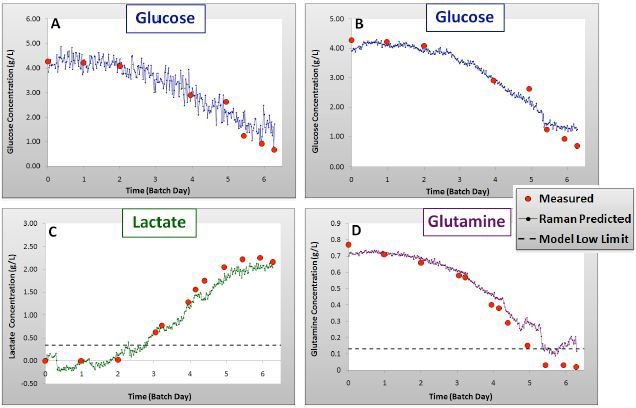
Figure 3. Validation results for glucose: univariate (A) and PLS (B), lactate (C) and glutamine (D) models showing Batch 4 measured and Raman predicted concentrations over time.
Table 1. Summary of calibration and validation results for glucose, lactate and glutamine PLS models. SEC = standard error of calibration, SEP = standard error of prediction.
| Constituent |
Self Prediction |
Cross Validation |
Batch 4 Validation |
| R2 |
SEC(g/L) |
R2 |
SECV (g/L) |
SEP (g/L) |
| Glucose |
0.99 |
0.16 |
0.97 |
0.33 |
0.34 |
| Lactate |
0.99 |
0.06 |
0.96 |
0.18 |
0.14 |
| Glutamine |
0.99 |
0.03 |
0.97 |
0.04 |
0.06 |
As can be observed in Figures 2 and 3 and Table 1, the calibration models created with the data of Batches 1–3 were efficiently predicted the concentrations of components in Batch 4, with R2 values of 0.99 for each component.
Conclusion
From the results, it is evident that cell cultures can be in situ monitored and analyzed in real time using the Raman analyzer. Aqueous-based systems can be conveniently and accurately analyzed using Raman with chemical specificity for cell culture metabolites and nutrients.
About Kaiser Optical Systems
Kaiser Optical Systems, Inc. is a world leader in spectrographic instrumentation and applied holographic technology. Principal products include Raman sensors and instrumentation, advanced holographic components for spectroscopy, and astronomy and ultra-fast sciences. Principal offices and the manufacturing facility are located in Ann Arbor, Michigan.
Their products and services are deployed throughout the world in such diverse applications as pharmaceutical and chemical manufacturing, nanotechnology, telecommunications, education, forensic science, deep-sea exploration, and astronomy. From particles smaller than a human hair to objects as large as planets, their products are providing their customers unique insights into both today’s as well as “age-old” questions.
Kaiser was founded in 1979 to meet the need for diffractive or holographic optics for the avionics market. Kaiser entered the spectroscopy market in 1990 with the introduction of the holographic notch filter. In 1993 Kaiser released their first Raman analyzer, the HoloProbe. In 2013, the company became part of the Endress+Hauser Group.
To better serve the European community, Kaiser opened a new subsidiary in Europe in 1998. Kaiser Optical Systems SARL is located in Lyon, France. Kaiser SARL supervises their distributor network within Europe.
This information has been sourced, reviewed and adapted from materials provided by Kaiser Optical Systems.
For more information on this source, please visit Kaiser Optical Systems.