The detailed morphology of a polymer product, i.e., the degree of orientation and the level of crystallinity of the polymer molecules, greatly affects its physical properties. Crystallinity of a polymer refers to what proportion of polymer molecules are structurally ordered into 3D lattices, whereas orientation describes the degree of alignment of the polymer chains in a particular plane or axis.
Poly(ethylene terephthalate) (PET) is a commonly used synthetic polymer that is available in different forms, ranging from fully amorphous structure to ~60% crystalline. In addition, it is possible to arrange the polymer chains isotropically or as highly oriented along one or two axes.
The degree of orientation and crystallinity is influenced by the exact processing conditions used for drawing or blowing PET films, fibers and bottles. Hence, crystallinity and orientation need to be quantitatively measured on both microscopic and macroscopic scales using to produce highly quality polymer products in a controlled manner.
Calibration Models
Infrared and Raman spectroscopy previously used univariate calibration models for polymer morphology characterization. These models leverage conformation- and crystallinity-sensitive bands’ well-established assignments. However, the band shapes and intensities are greatly affected by the molecular orientations in a material respective of its composition.
This problem can be avoided using multivariate calibration methods such as partial least-squares (PLS) modeling, which allow for all spectral variance rather than just individual bands. Raman spectra of amorphous and semi-crystalline PET films are presented in Figure 1, showing the bands that are susceptible to crystallinity (1730 cm-1) and conformation (1000 and 1096cm-1).
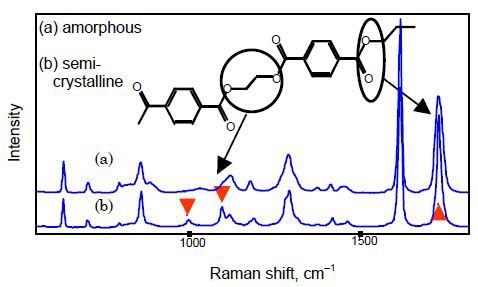
Figure 1. Raman spectra of (a) amorphous and (b) semi-crystalline PET films.
Experimental Procedure
PET films were produced under many different conditions. A density gradient column was used to determine bulk densities. Kaiser Optical Systems’ HoloProbeTM Raman system (current version is RamanRxn1™ Microprobe) equipped with an optical microscope and 10mW of 532-nm laser light was used to acquire Raman spectra using an exposure time of 4s. HoloProbe consists of a TE-cooled CCD detector, a holographic transmission-based spectrometer, and a filtered fiber optic probe head.
A HoloPlexTM transmission grating in the spectrometer collects two slightly overlapping spectral regions on the 2D CCD detector, thereby allowing simultaneous collection of the entire spectral range. The instrument has no moving components, thus having superior calibration stability and providing very precise multivariate calibration. The GRAMS/386TM software package was used to treat and analyze the spectra. Kaiser Optical Systems’ HoloMapTM software package can now be used to perform this task.
Depth Profiling
Different points on the edge of a PET film of thickness of 150µm were analyzed using a 50× objective with a 5-µm depth of focus. Analysis of bands at 1000 and 1096 cm-1 revealed that there was variation in morphology of the film from one surface to the other. These bands represent the trans-glycol conformer.
Hence, on the micron scale, the polymer’s morphology is not completely represented by its bulk density. A PLS calibration model was created to measure the local density at discrete points on a film. Raman spectra of a PET film at different depths are presented in Figure 2.
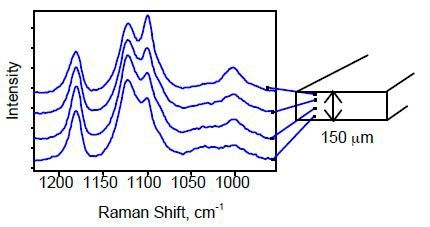
Figure 2. Raman spectra of the PET film at various depths. The spectra were obtained by focusing the incident light at various points down the edge of the film.
PLS Calibration
A 10× objective was used at the edge of the PET film to collect the data for use in the PLS calibration model for sampling the film’s entire thickness and determining bulk density values. A “leave-one-out” validation procedure was used to cross-validate the data (Picture 3). The use of two factors (principle components) in the model reduced the standard error of prediction (SEP).
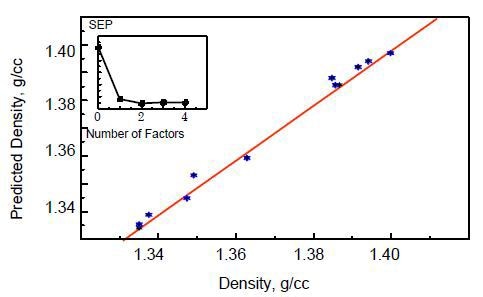
Figure 3. Cross-validated calibration plot of PET density.
In addition, the data grouping or block averaging approach was used to decrease the number of data points in every spectrum by dividing the wavenumbers into blocks consisting of eight points each and assigning the average intensity value of the points to the respective block. By this way, the resolution is reduced, yielding smoothed spectra with improved signal-to-noise ratio (S/N). This approach yielded an SEP of 0.0024 g cm-3.
Density Mapping with the Calibration Model
Using the calibration model, another PET film’s density was determined at different points across its thickness. The average value of bulk densities measured by the Raman analyzer was 1.350 g cm-3, which is consistent with the bulk density value determined using a density gradient column (1.349 g cm-3).
Conclusion
The use of HoloPlex transmission grating allows Raman systems to acquire the entire spectral range in a single “shot.” As a result, highly accurate multivariate calibrations can be performed. The density mapping results of a PET film using the PLS model were in good agreement with the bulk density data acquired by traditional techniques, but more informative owing to the ability to measure the density at discrete points.
About Kaiser Optical Systems
Kaiser Optical Systems, Inc. is a world leader in spectrographic instrumentation and applied holographic technology. Principal products include Raman sensors and instrumentation, advanced holographic components for spectroscopy, and astronomy and ultra-fast sciences. Principal offices and the manufacturing facility are located in Ann Arbor, Michigan.
Their products and services are deployed throughout the world in such diverse applications as pharmaceutical and chemical manufacturing, nanotechnology, telecommunications, education, forensic science, deep-sea exploration, and astronomy. From particles smaller than a human hair to objects as large as planets, their products are providing their customers unique insights into both today’s as well as “age-old” questions.
Kaiser was founded in 1979 to meet the need for diffractive or holographic optics for the avionics market. Kaiser entered the spectroscopy market in 1990 with the introduction of the holographic notch filter. In 1993 Kaiser released their first Raman analyzer, the HoloProbe. In 2013, the company became part of the Endress+Hauser Group.
To better serve the European community, Kaiser opened a new subsidiary in Europe in 1998. Kaiser Optical Systems SARL is located in Lyon, France. Kaiser SARL supervises their distributor network within Europe.
This information has been sourced, reviewed and adapted from materials provided by Kaiser Optical Systems.
For more information on this source, please visit Kaiser Optical Systems.