Lidocaine is an antiarrhythmic medicine and also serves as a local anaesthetic drug. It is utilized in topical application to relieve pain, burning and itching sensation caused from skin inflammations. This drug is mainly used for minor surgeries. Figure 1 shows the 1H NMR spectrum of 200 mM lidocaine in CDCl3.
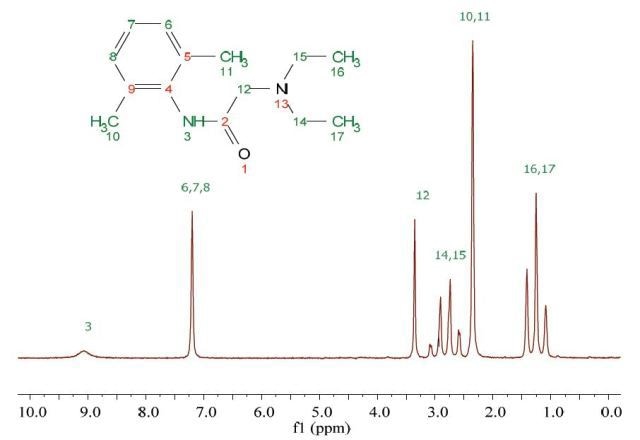
Figure 1. Proton NMR spectrum of 200 mM lidocaine in CDCl3.
1H NMR Relaxation
Figures 2, 3 and 4 show the relaxation time measurements. It can be seen that the relaxation times are shortest for the CH2 protons and longest for the CH protons. The first data point amplitude increases with the number of protons for the related peak.
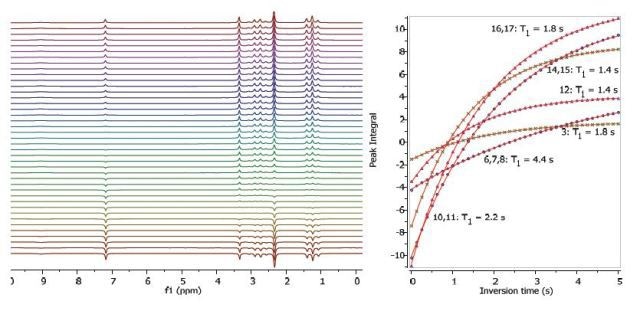
Figure 2. Proton T1 relaxation time measurement of 200 mM lidocaine in CDCl3.
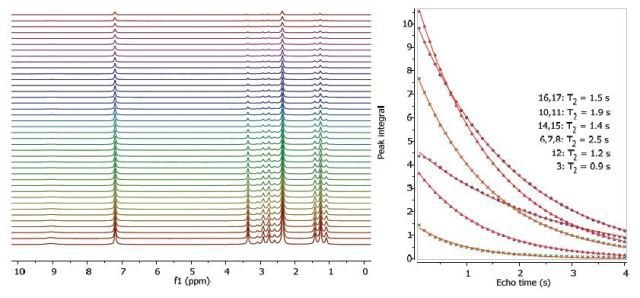
Figure 3. Proton T2 relaxation time measurement of 200 mM lidocaine in CDCl3.
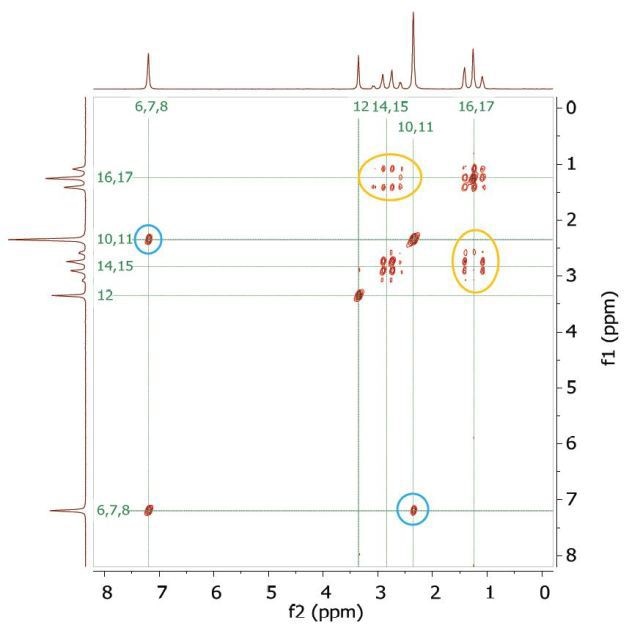
Figure 4. COSY spectrum of 200 mM lidocaine in CDCl3. The cross-peaks and corresponding exchanging protons are labeled by colour-coded arrows and ellipses.
2D COSY
Figure 4 shows the 2D COSY spectrum where two spin systems (6,7,8) to (10,11) can be clearly seen. For instance, the methyl groups at 10 and 11 positions bond to aromatic protons at 6 and 8 positions, while the methyl groups at 16 and 17 positions bond to the ethylene groups at 14 and 15 positions. No coupling occurs at positions (6,7,8) to (16,17) or (14,15).
2D Homonuclear J-Resolved Spectroscopy
The chemical shift in the 2D homonuclear j-resolved spectrum appears along the direct (f2) direction and the effects of coupling between protons appear along the indirect (f1) dimension. This enables the assignment of chemical shifts of multiplets and may help in measuring unresolved couplings. Also, a decoupled 1D proton spectrum is produced by the projection along the f1 dimension. The 2D homonuclear j-resolved spectrum of lidocaine, plus the 1D proton spectrum (blue line) are shown in Figure 5.
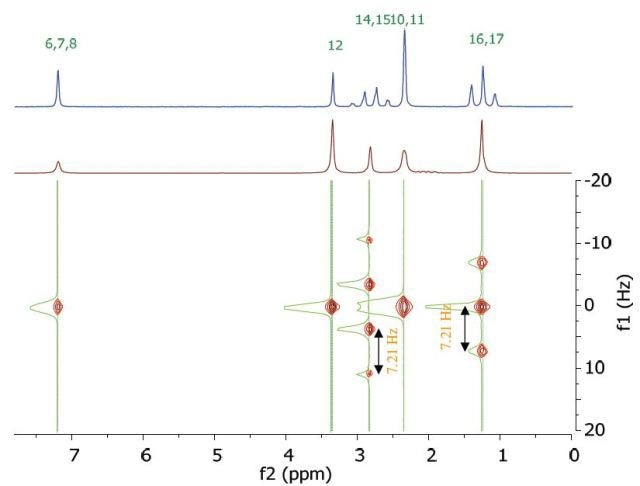
Figure 5. Homonuclear j-resolved spectrum of 200 mM lidocaine in CDCl3. The multiplet splitting frequencies for different couplings are colour- coded.
The projection which is vertical reveals how the multiplets disintegrate into a single peak, which makes the 1D spectrum more simplified. Peak multiplicities are produced by vertical traces from peaks in the 2D spectrum and help in determining the frequencies of proton-proton coupling. When coupling frequencies are compared between different peaks, information can be obtained regarding which peaks are bonded to each other. Also, Information regarding the coupling strength can be obtained from the size of the coupling frequencies. These couplings substantiate the results of the COSY experiment.
However, in this experiment, the effects of second order coupling appear in the f1 direction as additional peaks which are equidistant from the coupling partners detached from the zero frequency in the f1 dimension. These peaks provide proof of second order coupling partners, but are generally considered as artifacts. Figure 6 shows these coupling partners and additional peaks marked by colour-coded arrows and ellipses.
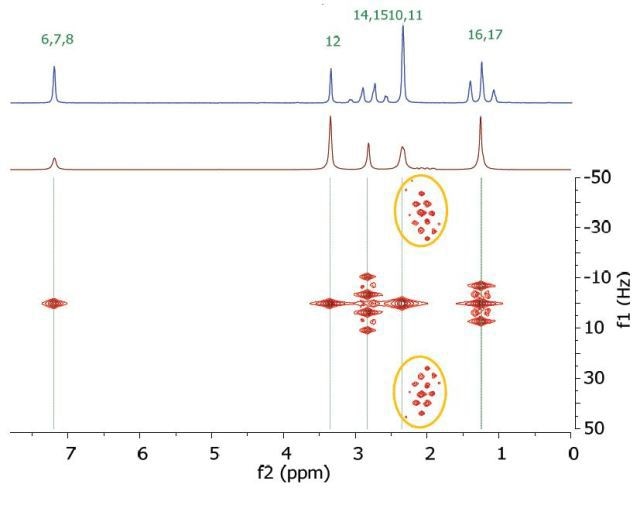
Figure 6. Homonuclear j-resolved spectrum of 200 mM lidocaine in CDCl3 showing the extra peaks due to strong couplings.
1D 13C Spectra
Figure 7 shows the 13C NMR spectra of 1 M lidocaine in CDCl3. Since the 1D Carbon experiment is highly susceptible to the 13C nuclei in the specimen, it easily and clearly resolves 9 resonances. In this experiment, only carbons coupled to protons are seen.
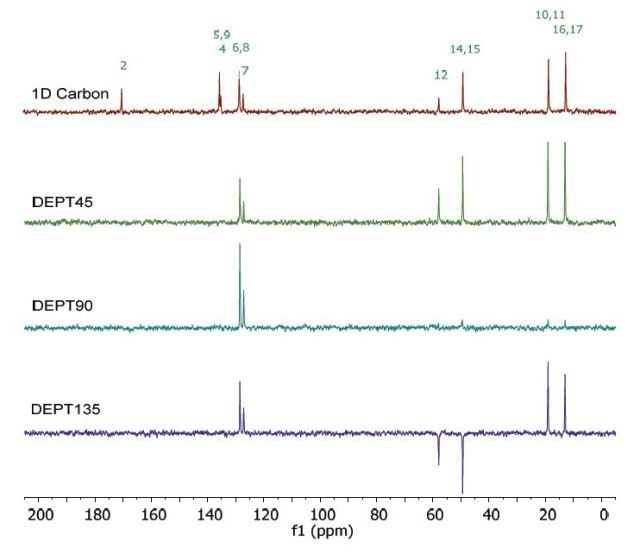
Figure 7. Carbon spectra of 1 M lidocaine in CDCl3.
Given the fact that the DEPT spectra do not display the peaks at 170 and 135ppm, they must be part of quaternary carbons. The DEPT-135 and the DEPT-45 experiments provide signals of CH3, CH2 and CH groups, while the DEPT-90 experiment provides only the signal of CH groups. However, in DEPT-135 the CH2 groups occur as negative peaks. It can thus be summed up that the peaks between 45 and 60ppm belong to ethylene groups; the peaks between 10 and 20ppm are part of the methyl groups; and the peaks between 125 and 130ppm belong to methyne groups. A similar study can be carried out on the C and CH peaks.
Heteronuclear Correlation
The Heteronuclear Correlation (HETCOR) experiment identifies the proton signal that appears along the indirect dimension and the carbon signal along the direct dimension. Figure 8 shows the HETCOR spectrum of 1 M lidocaine in CDCl3. in the 2D spectrum, the peaks reveal which proton is attached to which carbon. This experiment helps in resolving assignment uncertainty from the ID carbon spectra.
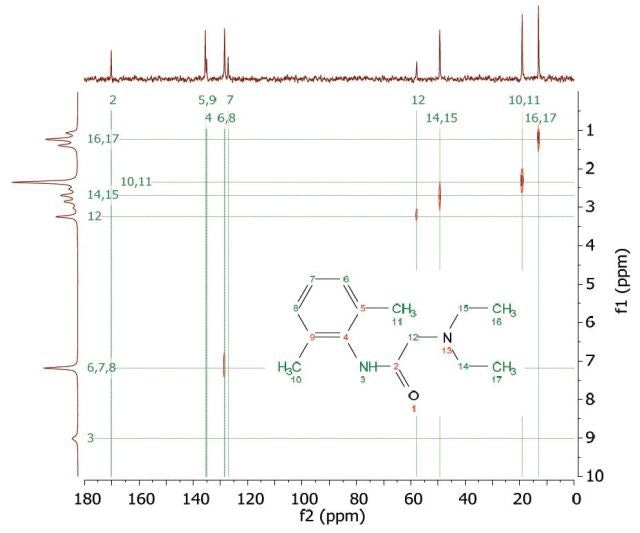
Figure 8. HETCOR spectrum of 1 M lidocaine in CDCl3.
Heteronuclear Multiple Quantum Coherence
Heteronuclear Multiple Quantum Coherence (HMQC) is similar to the HETCOR experiment and is utilized to associate proton resonances to the carbons that are coupled directly to those protons. But in the HMQC experiment, the proton signal appears along the direct dimension and the carbon signal along the indirect dimension. Figure 9 shows the HMQC spectrum of 1 M lidocaine in CDCl3. In the 2D spectrum, the peaks show which proton is attached to which carbon. For conclusive peak assignment, a similar study with the HETCOR spectrum can be carried out.
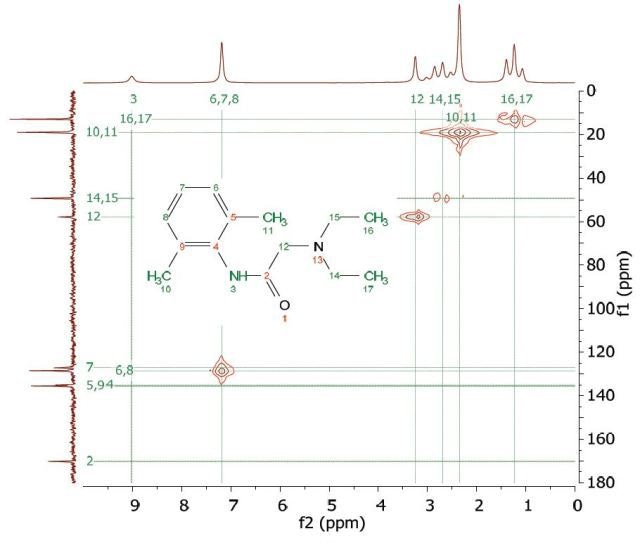
Figure 9. HMQC spectrum of 1 M lidocaine in CDCl3.
Heteronuclear Multiple Bond Correlation
The Heteronuclear Multiple Bond Correlation (HMBC) experiment can be employed to achieve long-range correlations of proton and carbon via two or three bond couplings. Similar to the HMQC experiment, the proton signal appears along the direct dimension and the carbon signal along the indirect dimension. Figure 10 shows the HMBC spectrum of 1 M lidocaine in CDCl3.
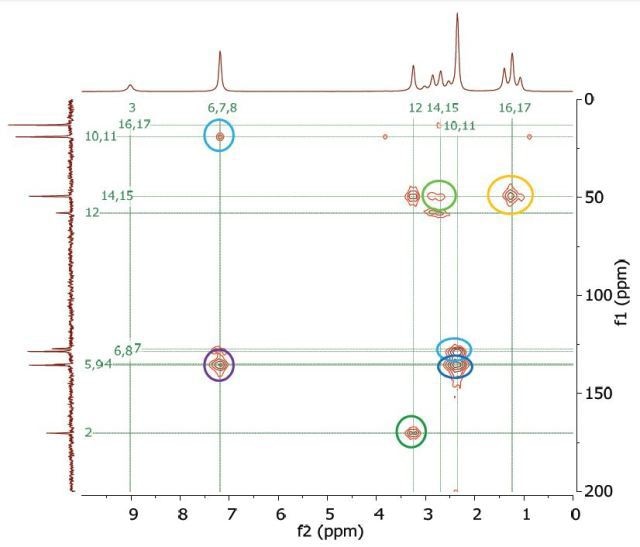
Figure 10. HMBC spectrum of 1 M lidocaine in CDCl3, with some of the long-range couplings marked.
The couplings amid the molecular positions appear analogous to the couplings seen in the COSY spectrum; however, the HMBC also displays couplings to quaternary carbons, which are not seen either in HMQC or COSY experiments. In addition, there is a correlation between protons and carbons. This is attributed to three-bond bonding from 14 and 15 and vice versa, as shown in light green in Figure 1.
Spinsolve Carbon NMR Spectrometer
Magritek has developed a high-performance, low-cost benchtop NMR spectrometer called Spinsolve Carbon. The advanced system now includes 19F, 13C and 1H capability and also 2D methods such as 2D JRES, COSY, HMQC and HETCOR. It is suitable for reaction monitoring, synthetic chemistry, chemistry education, and industrial QA and QC.
Specifications of the Spinsolve Carbon are as follows:
- Resolution: 50% linewidth < 0.7 Hz (16ppb)
- Frequency: 10.8MHz carbon, 42.5MHz proton
- Lineshape: 0.55% linewidth < 20Hz
- Weight: 55kg
- Dimensions: 58 x 43 x 40cm
- Stray field: < 2 G all around system
- Magnet: Permanent and cryogen free
Conclusion
Magritek’s Spinsolve Carbon benchtop NMR spectrometer is powerful, affordable and saves time, space and money. This revolutionary system delivers excellent performance and suitable for performing common 2D experiments.

This information has been sourced, reviewed and adapted from materials provided by Magritek.
For more information on this source, please visit Magritek.