The by-product of the cheese-making process is called whey, while the dietary supplement and food ingredient formed when components from milk are separated is known as whey protein isolate (WPI).
WPI has a large quantity of pure protein that is fat, cholesterol, lactose, and carbohydrate free. It is high in nutritional value. WPI is used in many products in the food sector:
- Health foods
- Infant formula
- Stabilizer
- Emulsifier
The four major components in WPI are:
- β-lactoglobulin – Mainly found in cow and sheep and many other mammals except human breast milk. It is a small protein containing 162 amino acids and a molecular weight of 18.4 kDa. It exists mostly as a dimer.
- α-lactalbumin – A protein found in milk of most mammals, and is required for lactose production. It has a molecular weight of 14,178kDa.
- Serum albumin – Produced by the liver and acts as a carrier protein for fatty acids, steroids, and thyroid hormones in the blood. By contributing to oncotic pressure, it balances extracellular fluid volume. This globular, water-soluble protein has a molecular weight of 65 kDa.
- Immunoglobulins – Has a molecular weight of 150 kDa, and is useful for neutralizing foreign objects.
In the following article, a WPI sample is analyzed using the Viscotek TDAmax Malvern Panalytical. The four main components of WPI are separated and studied.
Materials and Methods
The Viscotek TDAmax system consisted of ultraviolet (UV), refractive index (RI), intrinsic viscosity (IV), 90°angle light scattering (RALS), and 7°angle light scattering (LALS) detectors. The samples were divided with two Viscotek P-columns (300 x 7.8 mm ID), 1 x P4000 and 1 x P3000, with a protein molecular weight exclusion limit of 700 kDa and 1000 kDa, respectively. The mobile phase was 0.1 M pH 7.0 phosphate buffer with about 500 µg of total material injected for individual measurement. Using the OmniSEC software, the chromatograms were studied using the conjugate analysis.
Results and Discussions
Components characterization
Retention volume (RV) was plotted on the X-axis and on the Y axis, it was refractive index (RI), ultraviolet (UV), right angle light scattering (RALS), low angle light scattering (LALS), DP(viscometer), respectively.
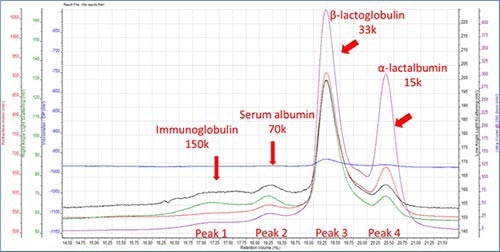
Figure 1. Component characterization.
Table 1
| |
Immunoglobulin |
Serum albumin |
β-lactoglobulin |
α-lactalbumin |
| Peak RV - (mL) |
17.057 |
18.174 |
19.238 |
20.349 |
| Mn - (Daltons) |
150,329 |
70,310 |
30,745 |
15,410 |
| Mw - (Daltons) |
151,366 |
70,469 |
31,847 |
15,549 |
| Mz - (Daltons) |
152,485 |
70,635 |
33,125 |
15,697 |
| Mp - (Daltons) |
127,955 |
69,619 |
30,683 |
15,800 |
| Mw / Mn |
1.007 |
1.002 |
1.036 |
1.009 |
| IV - (dL/g) |
0.0596 |
0.0506 |
0.0339 |
0.0289 |
| Rh(w) - (nm) |
5.181 |
3.833 |
2.564 |
1.921 |
| Wt Fr (Peak) |
0.024 |
0.064 |
0.737 |
0.175 |
The dn/dc of all proteins was fixed at 0.185. Molecular weight and weight fraction at Peak 3 was 33 kDa and 75%, respectively. This correlates to β-lactoglobulin, thereby indicating that it is the key component in WPI. β-lactoglobulin monomer has a molecular weight of 18.4 kDa but it still occurs as an active state dimer. Thus the 33 kDa peak is proven to represents the dimmer. α-lactalbumin/ peak 4 is detected to have a molecular weight 15kDa, thus coordinating with the theoretical data.
One of the observations revealed that the height of the RI peak for a-lactalbumin is less than half that of β-lactoglobulin, but the height of the UV signal was very identical. Therefore indicating that α-lactalbumin has a higher extinction coefficient than β-lactoglobulin at 280nm.
Based on the molecular weight, the 70 k was and 150 k peaks were assigned to serum albumin and immunoglobulin, respectively. As predicted the four peaks had narrow PD values less than 1.04 as protein generally has a narrow PD value. Due to the separation mechanism, the hydrodynamic radius values reduced with retention volume and established that proteins with lower molecular weight are smaller in size.
The intrinsic viscosity values also reduces with molecular weight; however this does not happen in a linear fashion, thereby displaying the difference in protein structure. This is exhibited by the intrinsic viscosity of the β-lactoglobulin dimer, which is only 15% higher than the value for the α-lactalbumin monomer although it is twice the molecular weight. Therefore this points to the fact that the dimeric β-lactoglobulin’s structure is more compact than that of the α-lactalbumin.
Aggregation Detection
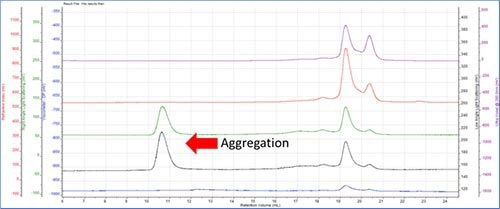
Figure 2.
The LALS and RALS detectors display single peaks at a low retention volume of 10-12 mL, whereas the RI or UV detectors do not have any peaks.
The RI and UV signals are proportional to concentration, hence the concentration of this peak happens to be very low. Light scattering is proportional to the molecular weight multiplied by the concentration, thus the molecular weight has to be very large so as to display a peak in the light scattering plot. The aggregate’s size clearly indicates the fact that it eluted at a low retention volume.
It was also detected that no peak was formed in the viscometer detector. The reason is that these aggregates are very compact and condensed having low intrinsic viscosity unlike fibrous or other structures.
Conclusions
The data procured from this single experiment indicates that the Viscotek TDAmax can characterize very complex protein mixtures such as those found in WPI if they can be well separated by the chromatography. It was possible to study all the four WPI components and characterize them based on their structure, concentration, molecular weight, and hydrodynamic size. Certain protein aggregates could also be identified by the light scattering detector even though they had very low concentration to enable full characterization.
Thus the capacity of the TDAmax makes it suitable for food and nutrition applications such as the above or other protein related applications such as biopharmaceutical study.

This information has been sourced, reviewed and adapted from materials provided by Malvern Panalytical.
For more information on this source, please visit Malvern Panalytical.