Trichodesmium is a well-known marine cyanobacteria (bluegreen algae) abundant in surface water of the tropical oceans. The morphological growth of this genus is widely researched by Biologists and Ecologists to get an insight of its acquaintance and utilization of nutrients such as micronutrient iron and phosphorus. Evaluating these parameters enable the biologists to determine their impact on eco-systems.
Figure 1 shows an example of Trichodesmium bacteria strand, which is approximately several millimeters long and 10 µm wide. The fibrous and elongated bacterial species are not suitable for traditional phytoplankton counting instruments. The bacterial growth in such cases is monitored through filtering of samples and counting up to 50 individual bacteria filaments using microscope. However, this process is time consuming, complex, and prone to errors.
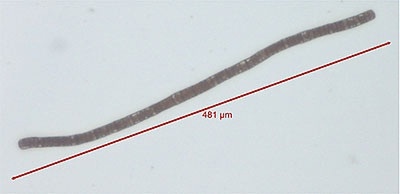
Figure 1. Morphologi G3 field of view color image of Trichodesmium bacterium.
This article presents a fully-automated analysis of suspended bacteria using the Morphologi G3 with the help of the wet cell accessory, which overcomes the limitations of traditional characterization techniques.
Sample Preparation and Morphological Image analysis Method
Approximately 2.5 ml of the sample suspension is injected into the wet cell accessory of the Morphologi G3. Figure 2 shows the design of wet cell accessory on the Morphologi G3. After processing the sample, the Morphologi records the parameters of size and shape such as fiber straightness, fiber elongation, fiber width and fiber total length.
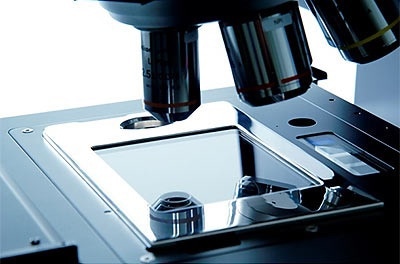
Figure 2. Schematic of wet cell accessory on the Morphologi G3.
Following the collection of morphological data, the full color images of specific filaments are obtained using the manual microscope mode for closer analysis of samples. The automated characteristic of the Morphologi instrument avoids the need of an operator to carry out tedious tasks such as the interpretation of high amounts of data. The changes in bacterial growth can be observed on a regular basis using this method and thereby delivering a significant enhancement in resolution to suit time based studies.
Experimental Results
The image of every bacterial filament is recorded during the measurement using Morphologi G3 instrument. In addition to the illustration of fiber specific parameters and recorded properties, the images of the longest bacterial filament measured during the experiment are shown in the Figure 3.
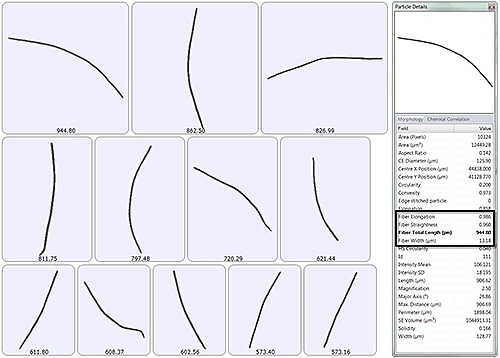
Figure 3. Example images of individual fibers by order of fiber total length and parameters recorded for every bacterium.
The assessment of the filament distribution can be observed from the composite image comprising all bacteria captured during the measurement. Figure 4 shows a region of composite image comprising captured bacterial filaments.
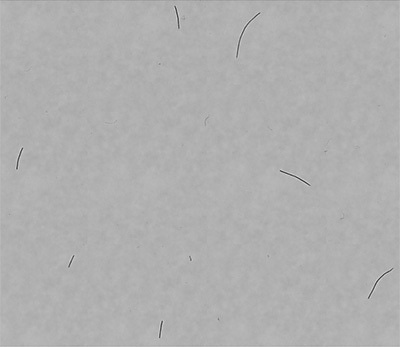
Figure 4. Portion of composite image.
The shape and size distributions of bacteria can be closely observed by frequency histograms. The formation of fiber total length for two suspensions of bacteria at varying times is shown in the Figure 5.
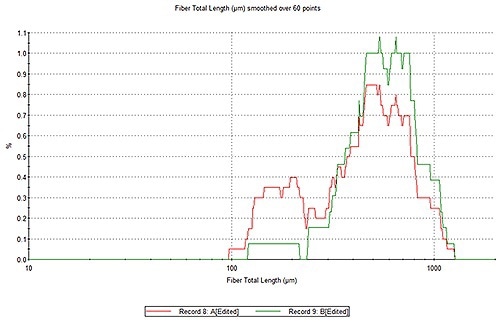
Figure 5. Overlay of fiber total length distributions measured on the Morphologi G3.
It is evident from the figure that the sample extracted earlier, indicated in red, contains shorter filaments than the ones extracted later, indicated in green. The changes in the morphology of bacteria with respect to time can be analyzed by comparing the sample distribution of cultures taken at different times. In this case, the filaments grow with time.
In order to quantify differences in samples, a classification chart comparing the samples with respect to temperature, nutrient supply and time was prepared. Figure 6 shows the comparison of two samples A and B.
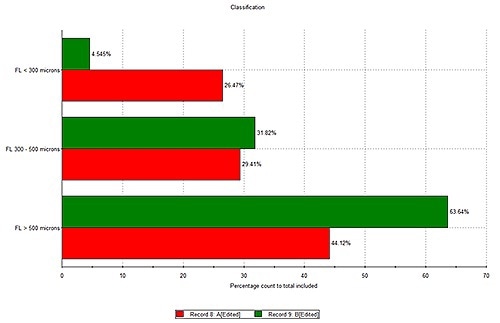
Figure 6. Classification chart of fiber total length populations.
The chart shows a higher percentage count of filaments for sample B with total fiber length > 500µm, and greater proportion of filaments for sample A with total fiber length < 300 µm. This indicates the growth of bacterial species.
Conclusion
When compared to conventional manual microscopy techniques, the Morphologi G3 shows excellent time-savings in characterization of Trichodesmium bacteria. The analysis using Morphologi G3 can be carried out for up to 18 samples in a day, providing efficient results on the changes in growth patterns of the bacteria. Significant numbers of bacteria filaments can be collected automatically and characterized without requiring the need of the operator for in-depth analysis.
In this article, Trichodesmium bacterial species were studied using the fiber mode of the Morphologi G3. The fiber mode could also be applied for other fibrous materials such as the elongated biological specimens, paper pulp, viruses or textiles.

This information has been sourced, reviewed and adapted from materials provided by Malvern Panalytical.
For more information on this source, please visit Malvern Panalytical.