The Mark–Houwink plot can be used to study polymer structure in solution as it clearly shows the relationship between structure and molecular weight (MW), with excellent sensitivity.
The molecular weight denotes the length of the polymer chains or level of polymerization but does not give any indication of structure on its own. The Mark–Houwink plot is produced by plotting the MW against the intrinsic viscosity (IV) on a log-log graph.
Intrinsic Viscosity
Expressed in dL/g, the intrinsic viscosity is defined as a measurement of the molecular density of the polymer chains in solution. The tighter the chains coil/fold in solution, the lower the intrinsic viscosity and the higher the density.
Given that this measurement is not dependent of the MW, two entirely different structures with the same MW can exhibit different intrinsic viscosities. For instance, a branched polymer and a linear (unbranched) polymer of the same MW will exhibit different intrinsic viscosities.
In addition, when the polymer changes structure across its MW distribution, it is possible to detect changes in the intrinsic viscosity. These aspects make the Mark-Houwink plot a powerful and useful tool.
The raw data for the Mark-Houwink plot is acquired from high-quality, multi-detection GPC/SEC data by integrating the intrinsic viscosity from a viscometer detector with the MW from a light scattering detector. Both sets of data are determined at each point across the sample’s elution profile. The ensuing plot can be utilized in a number of ways by appraising how close two structures are to making complicated quantitative measurements of polymer branching.
This article shows how to isolate the effects of a structural variation caused by a compositional change to a polymer and the structural change caused by polymer chain branching.
Materials and Methods
Samples were separated by means of two Viscotek T6000M columns. THF was the mobile phase stabilized with 300ppm BHT. In order to ensure complete dissolution, samples were made to dissolve overnight. The data was produced with the help of Malvern Panalytical’s OMNISEC system (Figure 1), which was set up as follows:
- Autosampler temperature: 15°C
- Flow rate: 1.0mL/min
- Detectors temperature: 35°C
- Column oven temperature: 35°C
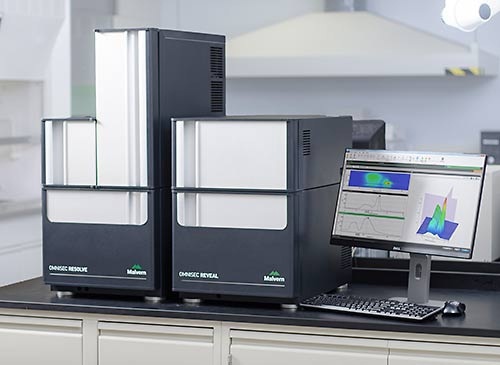
Figure 1. The OMNISEC system, comprising OMNISEC RESOLVE (left) and OMNISEC REVEAL (right).
All data acquisition, data reporting, data analysis, and system control were carried out through the OMNISEC software v10. The three polymer samples studied were all polystyrenes: the first is a linear polystyrene, the second a star branched polystyrene and the third is a brominated linear polystyrene.
Results
All three polymers are chromatographed under these conditions. Figure 2 shows a triple detection chromatogram of each sample, in each case revealing the viscometer, low angle light scattering (LALS) and RI signals.
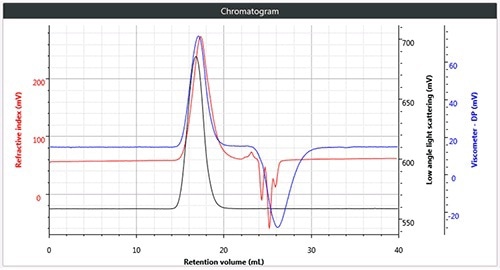
(a)
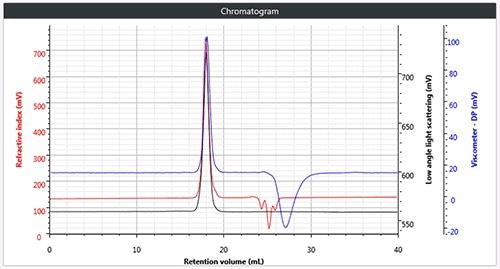
(b)
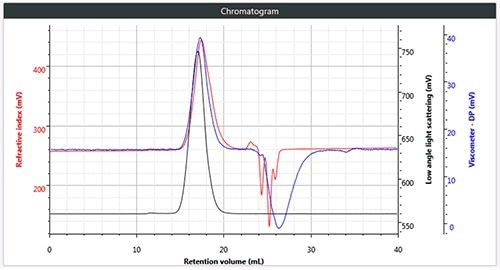
(c)
Figure 2. (a) Triple chromatogram of linear (unbranched) polystyrene; (b) triple chromatogram of star branched polystyrene; and (c) triple chromatogram of brominated polystyrene.
Data was obtained on the UV-vis photo-diode array detector in the OMNISEC system (UV-PDA). This helps in acquiring high-quality spectral data at each data point and enables identification and differentiation of sample.
Table 1 displays the numerical results for the three polymer samples. It is clear that the brominated and branched samples exhibit a different MW to intrinsic viscosity ratio. This is better described in the Mark-Houwink plot for the three polymer samples depicted in Figure 3.
Table 1. Numerical results of three polystyrene samples.
| Parameter |
Polystyrene samples |
| Linear |
Star branched |
Linear brominated |
| Retention volume (mL) |
17.360 |
17.943 |
17.447 |
| Mn (Da) |
108,810 |
114,650 |
262,240 |
| Mw (Da) |
237,090 |
123,120 |
541,850 |
| Mz (Da) |
371,520 |
133,050 |
970,640 |
| PD (Mw/Mn) |
2.179 |
1.074 |
2.066 |
| Intrinsic viscosity (dL/g) |
0.832 |
0.451 |
0.282 |
| Rhw (nm) |
13.904 |
9.528 |
12.688 |
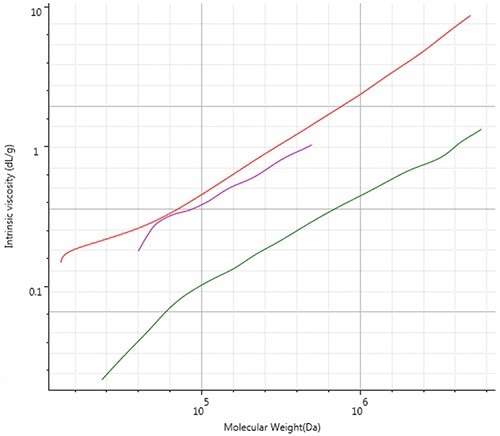
Figure 3. Mark-Houwink plot showing the structural differences between the 3 polystyrene samples. Linear in red, star-branched in purple, brominated in green.
From Figure 3, it can be observed that the linear polystyrene (shown in red) exhibits the highest intrinsic viscosity. The lowest density and most open structure, while the star branched polystyrene falls below the linear as the branching increases the density in solution.
The lowest on the plot is the brominated polystyrene, as the intrinsic viscosity at any given MW is considerably lower than the unbrominated samples. This is because of the replacement of the Hydrogen atoms on the styrene with Bromine atoms, leading to a higher MW for the brominated chains without increasing the molecular chain length in comparison to unbrominated polystyrene.
If there is more mass in the same chain length, it will lead to an increase in molecular density in solution and a decrease in intrinsic viscosity. Although both the brominated polystyrene and the star-branched polystyrene have lower intrinsic viscosities, it is not possible to differentiate the effect of structural change (branching) and the effect of bromination or substitution. Here, the spectral data from the UV-PDA can be possibly used.
(a)
(b)
(c)
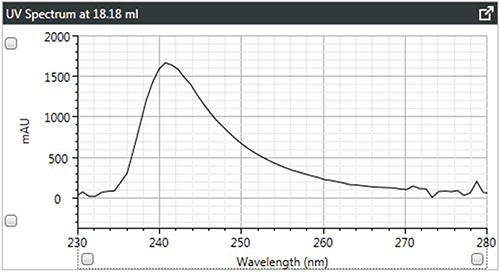
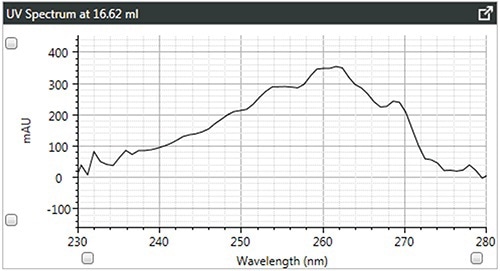
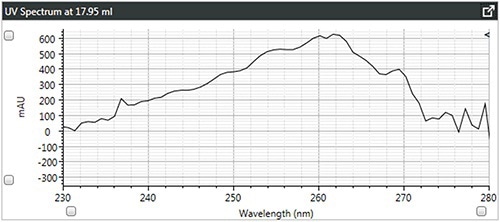
Figure 4. (a) UV spectra of brominated polystyrene; (b) UV spectra of linear polystyrene; and (c) UV spectra of star-branched polystyrene.
The UV spectra obtained from the peaks of the three samples is shown in Figure 4. It shows that the spectra for the branched and linear polystyrenes are quite similar and suggests that any variation in the Mark- Houwink plots could be due to branching.
As predicted, the brominated polystyrene spectrum is completely different from the polystyrene with the lamda-max moving from 262 to 241 nm, denoting its compositional variation.
Conclusion
High-sensitivity and high-quality multi-detection GPC/SEC data, like that obtained using the OMNISEC system, can prove to be a valuable tool for analyzing the effects of compositional and structural changes on polymers by utilizing the Mark-Houwink plot.
This article shows that the Mark-Houwink plot can be used to view the structural differences, such as branching independent of MW, and also distinguish that from substitutional or compositional changes by using UV spectral data.

This information has been sourced, reviewed and adapted from materials provided by Malvern Panalytical.
For more information on this source, please visit Malvern Panalytical.