Using traditional energy-dispersive spectroscopy (EDS) detectors to non-destructively analyze samples at high spatial resolution can be difficult, due to several factors influencing scanning electron microscopy including shading effects, electron beam damage and sample surface charging.
These limitations are easily resolved through XFlash® FlatQUAD silicon drift detector (SDD). This detector has unique geometry - the detector elements are arranged in an annular pattern, providing a high solid angle. The detector uses ultra-low beam currents to analyze topographically complex samples.
This article demonstrates the method of characterizing two meteorite fall samples – the Mocs historic meteorite fell on February 2, 1882 in Hungary and Tissint Martian meteorite that fell in Morocco on July 18, 2011, using the XFlash®FlatQUAD detector.
Figure 1a and 1b shows the historically cut sample of Mocs meteorite and an unexpected lead enrichment along cracks observed using Bruker M4 TORNADO benchtop Micro-XRF spectrometer.
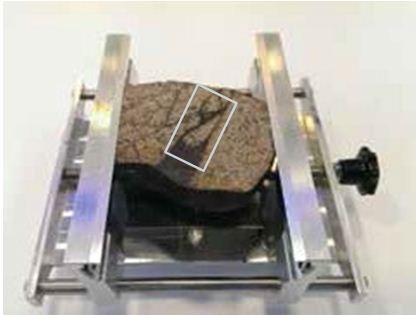
Figure 1a. Historically cut sample of Mocs meteorite
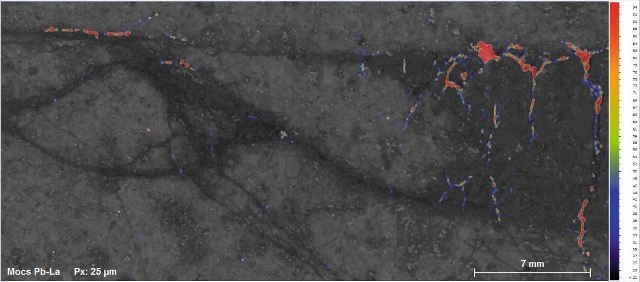
Figure 1b. Unexpected lead enrichment along cracks observed using Bruker M4 TORNADO benchtop Micro-XRF spectrometer
Experimental
The XFlash®FlatQUAD detector has an annular SDD arrangement placed between the sample and the pole piece. This special design is suitable for analyzing the samples with complex topography.
The four separate segments with high take-off angles collect X-rays to reduce shadowing effects. In addition, the large solid angle of up to 1.1sr allows EDS analysis with reasonable count rates with the help of ultra-low beam currents of < 10pA.
This results in minimizing the charging of nonconductive samples under high vacuum conditions. This approach allows non-destructive EDS analysis of sensitive topographic samples, avoiding the need for carbon coating and polishing.
Figure 2 shows the graph illustrating the X-ray excitation depth functions - the intensity of emitted X-rays based on the depth of sample.
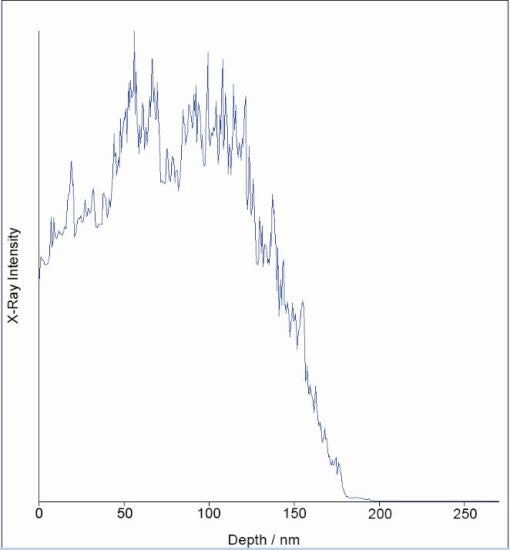
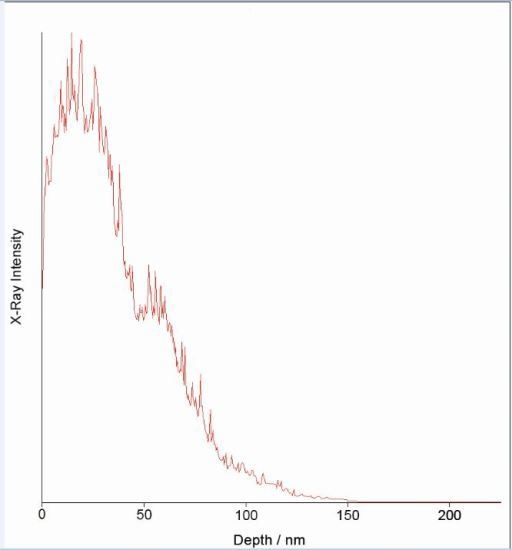
Figure 2. Graph showing the intensity of emitted X-rays based on the depth of sample
Figure 3 shows the deconvolution of peak overlaps of low to intermediate energy X-ray lines using an automatic routine and an extended atomic data base.
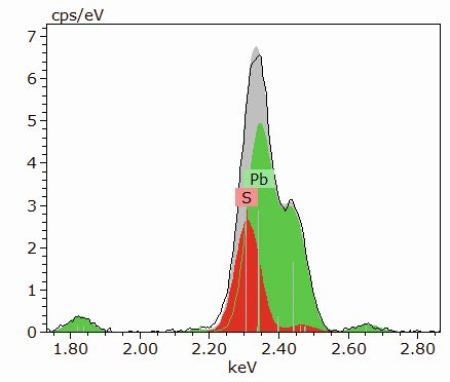
Figure 3. Deconvolution result of Pb (green) and S (red) showing the separation of the overlapping element lines lead M and sulfur K
While analyzing the Mocs meteorite, the detector identified a region of interest using an overview map in 47min. Further, a second map was carried out at high resolution overnight with 6kV and 130nm pixel size. By contrast, the Tissint Martian meteorite was analyzed overnight with 4kV and 55nm pixel size.
Results and Discussion
The area of the overview map of the Mocs meteorite is shown in the Figure 4a. It displays the enrichment of lead in the meteorite cracks, resulting from the lead-containing discs used as cutting tools in the past. Achieving sufficient data quality allows deconvolution of overlapping element lines and analysis of contamination of lead and sulfide minerals in the sample.
As shown in Figure 4b and 4c, the deposition of lead on sulfides and silicates can be shown from the EDS analysis. Surface contamination is indicated by the spherical carbon particles and filaments of sizes less than 300nm along with soot rising from heating the Natural History Museum of Vienna with coal-fired furnaces during the last century.
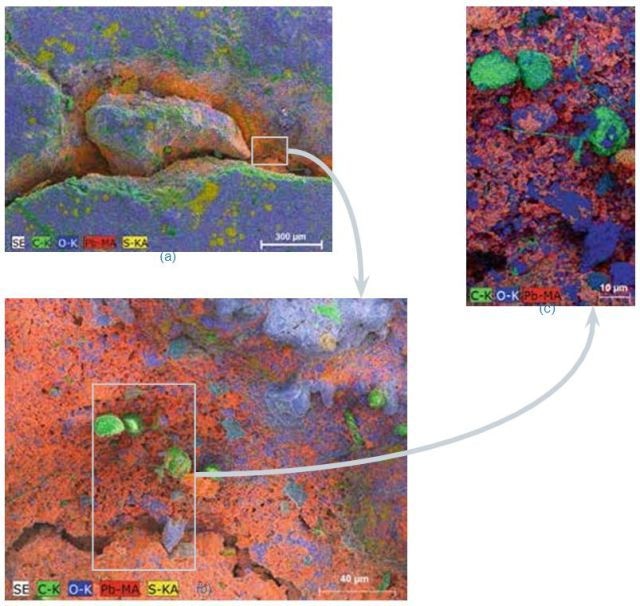
Figure 4. Mocs historic meteorite; Element maps of integrated peak intensities. a) The composite map overlaid with the SE micrograph reveals lead contamination from the historical cutting process. b) The composite map of the rectangular area in (a) overlaid with the SE micrograph shows that lead and soot is deposited on silicates. c) Image detail of the area shown in (b) without SE micrograph. It documents that carbon features < 300 nm in size (green filaments) can be made visible under high vacuum using low HV and ultra-low beam currents.
Figure 5 shows a portion of the Tissint Martian meteorite. The mapped area of the figure shows a thin coating and local enrichment of nitrogen and carbon associated with topographic features.
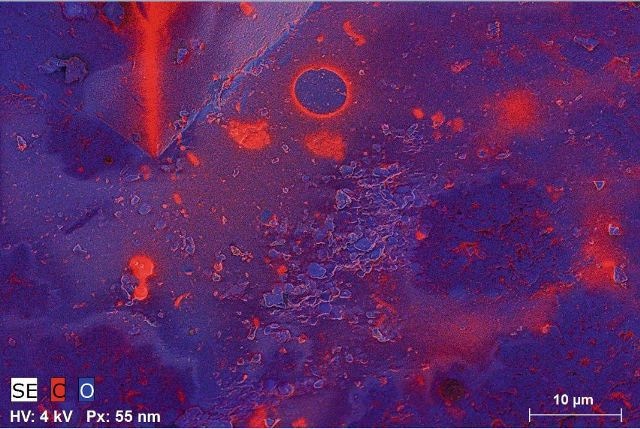
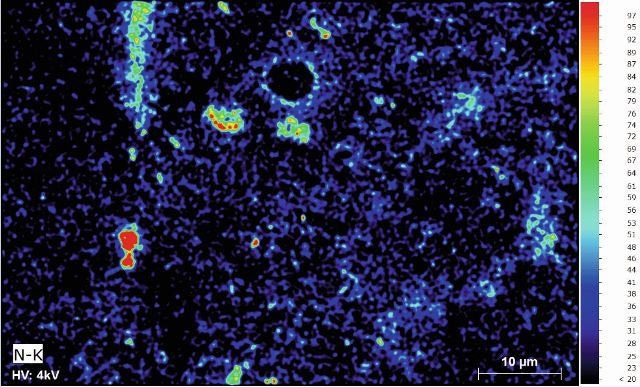
Figure 5. Tissint Martian meteorite; (a) the composite map of carbon and oxygen overlaid with the SE micrograph shows a thin coating and local enrichment of carbon on a silicate surface. (b) The distribution of nitrogen with low intensities can be made visible by using a false color display of the according map
Conclusion
Meteorite samples are ideal for demonstrating the characteristics of a new detector of the annular XFlash®FlatQUAD as they provide several analytical limitation factors associated with EDS.
In general, elemental analysis at low beam current and low accelerating voltages facilitates high detection sensitivity and high spatial resolution without using a conductive coating in low vacuum. When compared to low vacuum analysis, this technique minimizes beam skirting effects that affect the lateral resolution for EDS X-ray analysis owing to the collision of electrons with atoms or gas molecules.
Moreover, this approach has drastically reduced hydrocarbon contamination, providing the chances of analyzing precious or beam-sensitive specimens to study small scale structures. This also includes carbon containing surface layers that would otherwise be affected through carbon contamination.
Therefore, the use of meteorite samples is best-suited for demonstrating the characteristics of XFlash® FlatQUAD SDD through various analytical approaches in the field of nanoparticle characterization and biological and cultural heritage sciences.

This information has been sourced, reviewed and adapted from materials provided by Bruker Nano Analytics.
For more information on this source, please visit Bruker Nano Analytics.