The characterization and measurement of interactions between low-molecular weight (LMW) ligands and proteins are essential in drug discovery. One of the most common issues faced during the characterization of binding interactions is the need to evaluate a wide range of binding affinities (KD) and to precisely categorize and differentiate LMW ligands based on the mechanism of action, affinity and energetics of interaction.
However, the presence of inactive proteins or the erroneous evaluation of a protein concentration makes it difficult to achieve a reliable interpretation of binding data. The evaluation of this information is further complicated by uncertainties in the concentration of compound stocks.
Isothermal Titration Calorimetry
Isothermal titration calorimetry, also known as ITC, can directly determine the heat absorbed or released in a binding process. It makes it possible to study interactions between proteins and small molecules in a solution and eliminates the need for immobilization or labeling.
A combination of a high sensitive ITC system and optimized experimental conditions can help to justify the inaccurately assessed inactive protein fraction, protein concentration and concentration of compound solutions. Thus, ITC provides a better understanding of biochemical data, right from QC and assay development through to lead optimization.
This article demonstrates the benefits of the new ITC instruments: MicroCal PEAQ-ITC and MicroCal ITC automated systems, and MicroCal PEAQ-ITC analysis software.
Improved SAR
Active Protein Concentration Determination
ITC is used right through the initial stage of drug discovery to the final stage involving lead optimization. It can also be utilized in the protein purification QC step to evaluate batch differences and freeze-thaw stability.
The intermittent use of a positive control ligand makes it possible to monitor the quality of protein and validate active protein concentration across a set of ITC experiments.
The MicroCal PEAQ-ITC analysis software is capable of creating scatter plots of binding parameters for a sequence of successive titrations. Such plots make it possible to identify possible trends as well as potential problems relating to assay setup and reagent quality.
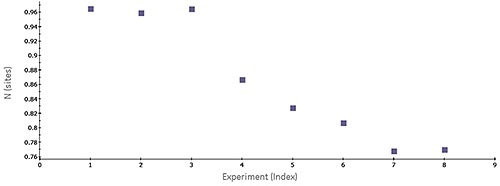
Figure 1. Scatter plot of N-values generated by MicroCal PEAQ-ITC software for a series of consecutive titrations of 5 pM bovine carbonic anhydrase II (bCAII) with 50 pM ethoxzolamide in phosphate-buffered saline (PBS), 25°C. The experiments were conducted in the MicroCal ITC Automated system.
Figure 1 shows a scatter plot of N values acquired for a set of successive ITC titrations, revealing a trend in apparent number of binding sites on the target protein. The steady decrease in N value over time most likely reflects the stability problems of the target protein. Common issues associated with analyses of protein-ligand interactions are batch-to-batch variation, limited protein stability, and limited freeze-thaw stability of a target protein.
ITC data is important to ascertain whether one batch of protein differs in apparent activity (binding) relative to earlier batches and offers possible normalization criteria, which prove helpful across many assays run during the screening and characterization process.
With active protein concentration utilized in the ITC data study, any residual errors in the apparent stoichiometry can be assigned to inaccurate concentration determination of the ligand.
Accurate Ligand Concentration Determination
In drug discovery, the concentration of compound solutions is given with considerable errors which directly impact the quality of the binding parameters returned by fitting binding information, particularly in the accurate determination of the entropic and enthalpic contributions to binding.
The MicroCal PEAQ-ITC analysis software makes it possible to detect and justify the error in the compound’s concentration and helps reduce any erroneous results in the thermodynamic measurements.
Figure 2 shows the scatter in the stoichiometry (N) ascertained by ITC for an interaction of a target protein with a sequence of LMW hits in a drug discovery and development project, performed using the MicroCal Auto iTC200 system. The N values, which ranged between 0.2 an 1.8, were not correlated with an inactive protein fraction.
Moreover, 1:1 binding stoichiometry was predicted for the compounds based on X-ray structures of the complexes. It was obvious that variations in the apparent stoichiometry were the result of imprecise determination of the ligand concentrations.
These errors affect the enthalpy data produced by the ITC and hence make it difficult to understand the variations in the thermodynamics of interaction of each ligand to the target protein.
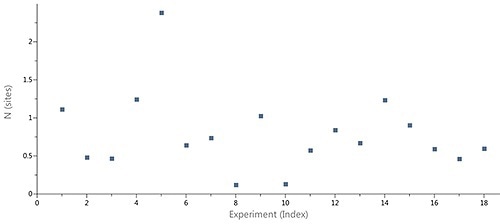
Figure 2. Case study (client-provided data). Summary of N values obtain for interactions of a target protein with a series of LMW hits in a drug discovery and development project conducted on MicroCal Auto iTC200.
The MicroCal PEAQ-ITC analysis software can justify this by enabling the LMW ligand concentration in the syringe to differ, while setting stoichiometry value to 1 in the fitting process. The enthalpy data returned with and without this correction factor is shown in Figure 3.
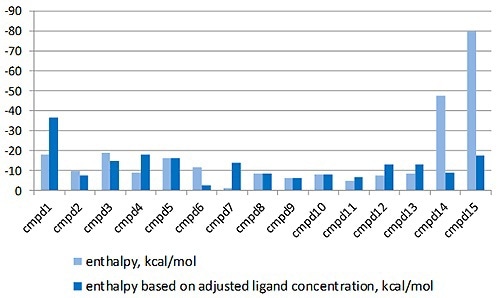
Figure 3. Comparison of the enthalpy data returned for the interaction of a series of LMW hits with a target protein in a drug discovery program, with (light blue) and without (dark blue) the correction for ligand concentration. The compounds are listed in order of descending affinity.
It is apparent that the enthalpy data returned is radically different when the errors in ligand concentration are considered in the study and will have a major effect on the interpretation of the structure activity relationships (SAR) of this lead optimization study.
Another outcome of incorrect ligand concentrations is that experiments might be too complex to analyze because of the incomplete nature of the binding isotherm and may need to be performed again. An example of this is illustrated in Figure 4.
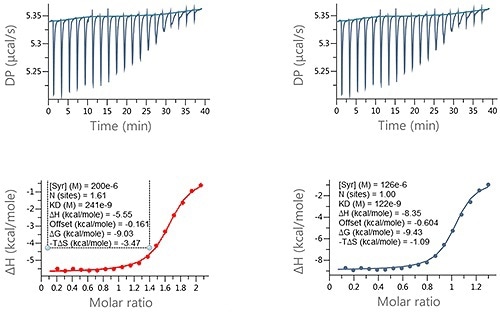
Figure 4. Examples of ITC data for the titration of a LMW ligand into a protein where the ligand concentration was in significant error. Raw ITC data (upper panels) and integrated data fitted to One-set-of-sites interaction model (lower panels). The fit was conducted (A) without and (B) with accounting for error in compound concentration. The insets in the lower panel contain the fitted parameters returned by the analysis software.
The MicroCal PEAQ-ITC analysis software is able to accommodate these incomplete binding isotherms by utilizing a constant offset, denoting the control heats in the fitting process.
By varying the ligand concentration and combining the control offset in the fitting process, prior difficult data sets can be studied automatically in a non-subjective way.
In majority of cases, this is adequate for the application and can be utilized to establish the precise concentration of the compound stock.
In this analysis, the ligand concentration was expected to be 200 µM but was noted to be 126 µM. This error had a major effect on the entropy (-TAS) and enthalpy (AH) which changed by 2.28 kcal/mol and -2.8 kcal/mole, respectively, while the KD changed from 241 µM to 122 µM.
These variations underscore the value of the novel features in the MicroCal PEAQ-ITC analysis software and the advantages it will bring to powerful data interpretation.
Simultaneous Affinity Determination for Isomers and Enantiomers
A large number of compounds are produced as mixtures of isomers or enantiomers in late-stage drug discovery. In most of these cases, the compound mixture can be isolated by high-performance liquid chromatography (HPLC) and it is possible to test one or more isomers individually.
However in certain cases, separation can prove very difficult and take a significant amount of time, and hence in these cases it is necessary to test the mixtures directly. Biochemical assays give data regarding the tightest binding component in the mixture, while ITC offers binding data regarding both the weak and strong binder concurrently in a single experiment.
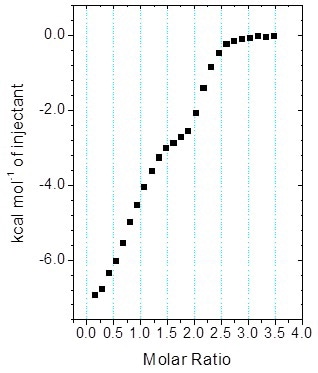
Figure 5. MicroCal iTC200 data for the titration of enantiomeric compound into target protein (client-provided data). The binding isotherm is clearly biphasic; however, analysis of the data with Origin ITC data analysis was not straightforward.
Figure 5 shows the biphasic binding isotherm, demonstrating how the ITC information may appear for the injection of an enantiomeric ligand mixture into a target protein within the cell.
Likewise, biphasic isotherms are seen when high affinity ligands are deliberately combined with weaker ligands to determine KDs beyond the range of direct measurements.
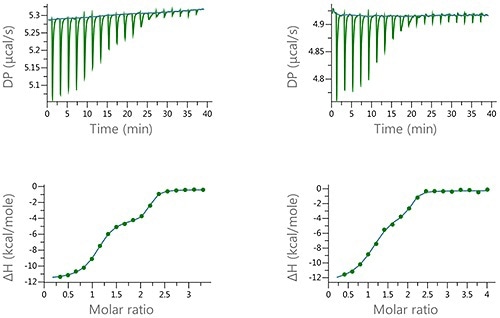
Figure 6. Raw and normalized heat plots for the titrations of the 1:1 mixture of EZA and FUR into bCAII. The titrations were carried out at 160 pM total concentration of the compounds in the syringe and 10 pM concentation of bCAII in the cell (left) or at 100 pM concentration of the compound mixture and 5 pM concentation of bCAII in the cell (right). 18 x 2 pl injection were made and the buffer was PBS, 2 v/v % DMSO at 25°C.
The data depicted in Figure 6 denotes the type of biphasic isotherm data which is anticipated for an enantiomeric mixture or a ‘syringe’ competition experiment.
Thus, these experiments show the degree of resolution that could be obtained through the MicroCal PEAQ-ITC and offers the possibility of quantitative characterization of the binding of mixtures.
With the help of the MicroCal PEAQ-ITC analysis software, the fitting of complex ITC data has been made easier when compared to the analysis software available on earlier models.
Conclusion
The MicroCal PEAQ-ITC instrument, together with enhanced signal stability, signal-to-noise, and mixing characteristics, features data analysis software that is suitable for biophysical labs involved in small-molecule drug discovery. The investigation is fully automated and reduces user subjectivity in evaluating analysis process and data quality.
The assessment of the data quality and the fitting process is carried out rapidly, enabling analysis of large data sets of experiments within a matter of seconds. Important features of the MicroCal PEAQ-ITC analysis software make it possible to determine the ligand concentration and the active concentration of the target protein when suitable controls are utilized. This makes it possible to precisely determine the thermodynamic and affinity, enabling exact structure- activity relationship in lead optimization and hit validation studies.
Moreover, the ITC data analysis software is equipped with tools that streamline the fitting of complicated binding isotherms that could be observed when titrating with mixtures of enantiomers, or with targets having more than one binding sites.

This information has been sourced, reviewed and adapted from materials provided by Malvern Panalytical.
For more information on this source, please visit Malvern Panalytical.