The following are concerns when measuring a small sample of dry powders:
- It is not representative of the bulk
- Small quantities of oversized particles may be left undetected.
Oversized particles may create issues with dissolution rates, powder handling, and the bioavailability of active pharmaceutical ingredients (APIs). This article demonstrates the advantage of using the Mastersizer 3000 and Aero S dispersion unit to determine a small amount of anomalously large particles fed into a small aliquot in a 'seeding' experiment.
A fine grade of lactose, with a Dv (50) of 4 µm, was selected as a model material for pharmaceutical APIs or excipient powders. A known sample of glass beads with a Dv (50) of 62 µm – the Quality Audit Standard (QAS) of Malvern Panalytical – was used as the anomalous particles.
Lactose 'Seeding' Experiment
This experiment involved weighing out four 20 mg aliquots of lactose. Careful handling of the powder was essential to prevent compaction or adhesion to the weigh boat. One of the aliquots was taken as a reference, and 1 mg of QAS glass beads was mixed to the rest (Figure 1).
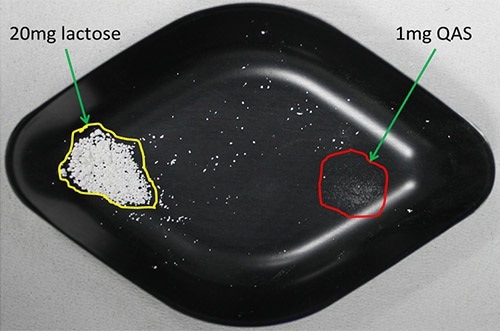
Figure 1. Weigh boat prepared with 20mg lactose and 1mg QAS glass beads.
Experimental Results and Discussion
Figure 2 shows the particle size distribution measured for a single 20 mg aliquot of lactose, revealing a reproducibility of below 1% RSD for Dv (50) of 4 µm. The particle size distribution measured for a single shot of QAS glass beads with Dv (50) of 62 µm is shown in Figure 3. Figure 4 presents the particle size distribution of the seeded sample (i.e., 20 mg of lactose seeded with 1 mg of QAS), clearly showing the contribution from the QAS as a separate peak with a mode of roughly 60 µm.
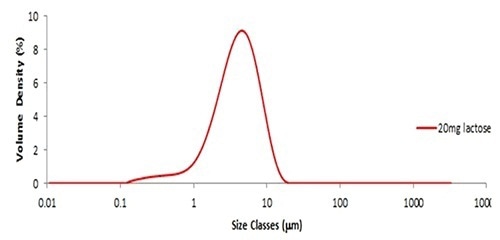
Figure 2. Particle size distribution obtained from 20mg of fine grade lactose.
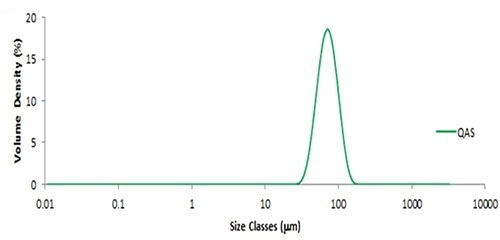
Figure 3. Particle size distribution obtained from QAS glass beads.
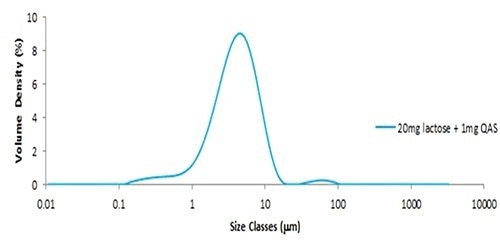
Figure 4. Particle size distribution obtained from lactose seeded with 1mg QAS glass beads.
Table 1 shows the influence of the addition of QAS on the slight increase in the percentiles. Although the mass ratio of QAS with lactose is 1:20, the number ratio is lower by several orders of magnitude based on a simple calculation.
Table 1. Particle size statistics and measurement reproducibility based on three measurements.
| |
Dv (10) (µm) ISO 5% |
Dv (50) (µm) ISO 3% |
Dv (90) (µm) ISO 5% |
| Seed 1 |
1.40 |
4.06 |
9.01 |
| Seed 2 |
1.40 |
4.01 |
8.81 |
| Seed 3 |
1.39 |
4.03 |
8.98 |
Mean
1xStd Dev
1RSD (%) |
1.40
0.0086
0.616 |
4.03
0.0226
0.562 |
8.94
0.106
1.19 |
| Ref 20mg lactose |
1.38 |
3.99 |
8.54 |
The use of the Mastersizer 3000 and Aero S dispersion unit produced highly reproducible results with slightly higher than 1% RSD for Dv (90) even in the presence of the QAS. This is well within the limits of the ISO standard for laser diffraction, which advises less than 5% RSD for Dv (90) for repeated measurements of the same sample.
Conclusion
Measuring small quantities of dry powders is a prerequisite in some of the industries, including pharmaceutical. Powders are typically fine with a tightly controlled size distribution. Nevertheless, it is advantageous to detect the small numbers of oversized particles.
This case was demonstrated by measuring a fine grade of lactose, seeded with glass beads, using the Aero S and Mastersizer 3000. The results clearly demonstrate the ability of this instrumental configuration to easily and reproducibly detect the "seeded" large particles.

This information has been sourced, reviewed and adapted from materials provided by Malvern Panalytical.
For more information on this source, please visit Malvern Panalytical.