Discovered by Louis Pasteur in 1861, dextran is a polysaccharide which is soluble in aqueous media and has minimal side-effects, making it widely used in the medical field as well as other application areas.
Eye drop lubricants, antithrombotic agents that lower the viscosity of blood to prevent blood clotting, and intravenous solution components for parenteral nutrition are some of the medicinal applications of dextran.
In these applications, the behavior of each dextran sample is influenced by its molecular weight. For instance, the removal of dextran samples with molecular weights above 60 kDa from the blood is not easy, thus exhibiting blood thinning effects for a period longer than lower molecular weight versions.
Dextran-40, which has a molecular weight of 40 kDa, is the most widely used dextran for anticoagulation therapy.
Acute renal failure is a rare but possible negative side-effect of dextran, caused by the structure and intrinsic viscosity of dextran. Therefore, accurate analysis and molecular weight characterization of dextran samples is essential.
Characterization with GPC/SEC Systems
The characterization of many different macromolecules, from natural proteins and polymers to bulk synthetic polymers, is usually carried out by means of gel permeation chromatography (GPC) or size-exclusion chromatography (SEC).
A complete setup for a GPC/SEC system is shown in Figure 1. Using this system, macromolecules can be characterized for their molecular weight distribution, molecular weight moments, hydrodynamic size, and intrinsic viscosity.
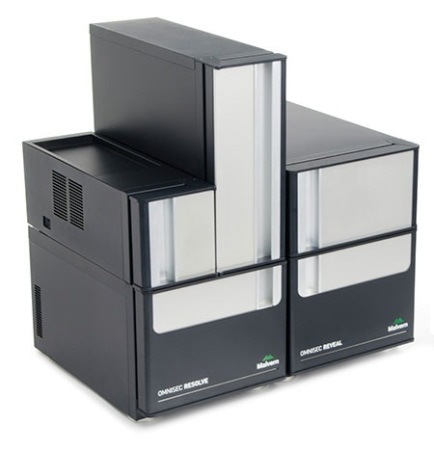
Figure 1. Malvern Panalytical’s OMNISEC Triple Detection GPC/SEC System
In a GPC/SEC system, a liquid mobile phase transfers a solvated sample through an analytical column consisting of porous gel particles, where the macromolecular components are separated by diffusion control, and the sample is eventually investigated as each slice of sample elutes by different detectors.
A viscometer plus refractive index and light scattering detectors are commonly present in an advanced detection GPC/SEC setup.
Experimental Procedure and Results
A series of dextran samples with varying molecular weight from 1 to 650 kDa were analyzed in this experiment. The samples were then structurally compared against other polysaccharides, gum arabic and pectin.
The GPC/SEC analysis was started with preparation of 10 dextran samples in an aqueous mobile phase of 0.05M Na2SO4. Two A6000M columns were used to for the sample analysis at a flow rate of 1mL/min.
The refractive index chromatograms and LogMW plots for all 10 dextran samples are presented in Figure 2, illustrating the range of molecular weights (from 1kDa to more than1,000kDa) with the continual decline of the LogMW plots.
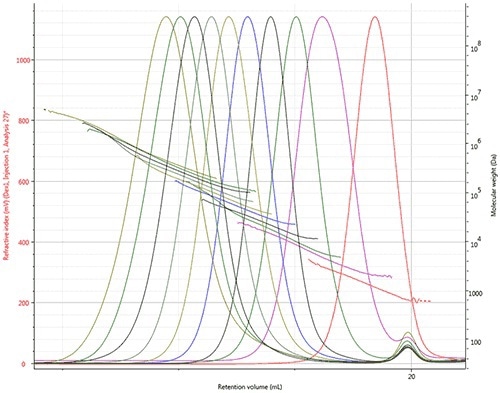
Figure 2. Overlay of refractive index chromatograms and LogMW plots of the dextran samples
Figure 3 shows the chromatogram of sample Dex7, demonstrating the performance of triple detection by displaying the viscometer signal in blue, the refractive index detector signal in red, the low angle light scattering (LALS) in black, and the right angle light scattering (RALS) signal in green.
The molecular weight distribution of the sample can be visualized by displaying the calculated molecular weight at each retention volume in gold.
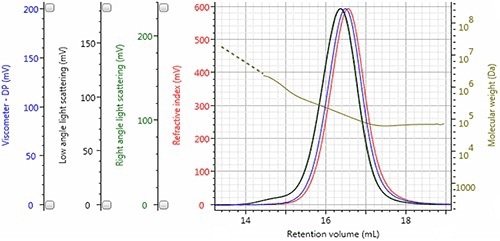
Figure 3. Triple detector chromatogram of sample Dex7; LogMW is shown as a gold line.
The molecular data collected for the dextran samples, including the molecular weight moments (Mn, Mw, and Mz), hydrodynamic radius (Rh) , intrinsic viscosity ([η]) , are summarized in Table 1, corroborating the trend illustrated in Figure 2.
There is an increment in the intrinsic viscosity, molecular weight and molecular size of each dextran sample throughout the series.
Table 1. Molecular data derived for the dextran samples.
| Sample ID |
Mn (Da) |
Mw (Da) |
Mz (Da) |
PDI |
[η] (dL/g) |
Rh (nm) |
dn/dc |
| Dex1 |
1,109 |
1,278 |
1,486 |
1.152 |
0.0368 |
0.895 |
0.15 |
| Dex2 |
4,312 |
5,553 |
7,319 |
1.288 |
0.0705 |
1.797 |
0.15 |
| Dex3 |
9,677 |
12,220 |
17,820 |
1.263 |
0.1048 |
2.664 |
0.15 |
| Dex4 |
21,200 |
24,190 |
27,800 |
1.141 |
0.1543 |
3.852 |
0.15 |
| Dex5 |
42,480 |
49,520 |
58,750 |
1.166 |
0.2213 |
5.503 |
0.15 |
| Dex6 |
70,700 |
84,530 |
104,400 |
1.196 |
0.2840 |
7.127 |
0.15 |
| Dex7 |
125,400 |
153,000 |
207,800 |
1.220 |
0.3790 |
9.527 |
0.15 |
| Dex8 |
206,200 |
269,000 |
425,000 |
1.305 |
0.4633 |
12.18 |
0.15 |
| Dex9 |
292,100 |
412,000 |
614,300 |
1.411 |
0.5045 |
14.36 |
0.15 |
| Dex10 |
456,500 |
658,500 |
1,087,000 |
1.443 |
0.6045 |
17.74 |
0.15 |
Observing the Mark-Houwink plot in Figure 4 is another approach to viewing these trends, showing the [η] of the sample at each Mw over the entire molecular weight distribution.
On a Mark-Houwink plot, samples with different molecular weights, but having similar structures, must be in the same line. A line is formed ranging below 1,000Da to more than 1,000,000Da, as expected due to overlapping of the Mark-Houwink plots of the dextran samples.
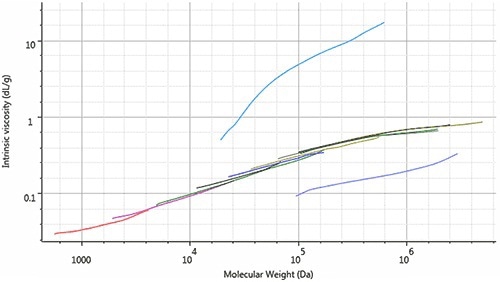
Figure 4. Mark-Houwink overlay plot of dextran series (central clustered line), gum arabic (bottom), and pectin (top) samples
Conversely, on the Mark-Houwink plot, samples with different molecular structures appear in different points based on their molecular density. More dense samples exhibit a lower intrinsic viscosity and therefore appear closer to the bottom of the plot, whereas higher intrinsic viscosity is exhibited by less dense samples (such as the problematic dextrans causing acute renal failure), which appear at the top of the plot.
This concept was described by analyzing a gum arabic sample and a pectin sample. As a natural gum substance, the gum arabic sample is more dense when compared to dextran, thus appearing below the dextran series on the Mark-Houwink plot (Figure 4).
Pectin, being a commonly used gelling agent, appears above the dextran series on the Mark-Houwink plot (Figure 4). These results reveal that the viscosity of pectin is higher than expected for a gelling agent, although the molecular weight is the same for the two samples.
Conclusions
The results of the analysis of a series of dextran samples with different molecular weights from 1kDa up to over 650kDa reveal that unprecedented molecular characterization data can be obtained with Malvern Panalytical's OMNISEC triple detection GPC/SEC system. The use of the Mark-Houwink plots of the samples demonstrated structural consistency.
The analysis of a gum arabic and pectin sample for comparison illustrated the structural differences between samples that are observable. These measurements provide more insight into the molecular characteristics defining the behavior of these indispensable materials.
These results also allow for accurate control over key parameters, including molecular weight and structure, and better targeting of dextran products and grades to the specific applications.

This information has been sourced, reviewed and adapted from materials provided by Malvern Panalytical.
For more information on this source, please visit Malvern Panalytical.