In the past 10 years, the pharmaceutical industry has been moving towards a design space approach to development and manufacture – an approach that has been defined by ICHQ8, Q9 and Q10, and the concept of Quality by Design (QbD). A design space approach is mainly focused on the project areas that are the most prone to failure, and therefore its value for risk management is more.
This article discusses how a QbD approach can inform the design and manufacture of analytical instrumentation, highlighting the advantages for those who are looking to use the instruments. These practicalities are demonstrated by examples from the development of the Mastersizer 3000 particle size analyzer.
Defining the QbD Approach
According to International Conference of Harmonization document Q8(R2) (ICHQ8), the QbD approach can be defined as a systematic approach to development that begins with predefined objectives and emphasizes product and process understanding and process control, based on sound science and quality risk management.
The core concept of QbD is that quality must be an integral part of a product right from the outset. An established QbD workflow for developing a pharmaceutical product is shown in Figure 1. Firstly, it is important to define how the product needs to behave in order to provide the necessary clinical efficacy. This is known as the quality target product profile (QTPP).
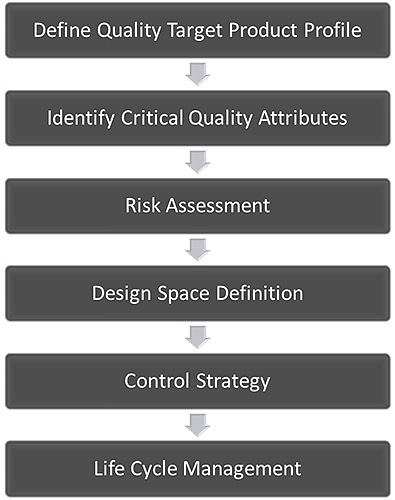
Figure 1. The QbD workflow for the development of a pharmaceutical product.
A simplified version of the product design process used by Malvern Panalytical for instrument development across all of its products, and how this is mapped onto the established QbD workflow, is given in Figure 2. A market requirement specification (MRS) provides the QTPP or target for QbD workflow that offers a summary of the features that are presently preferred by customers.
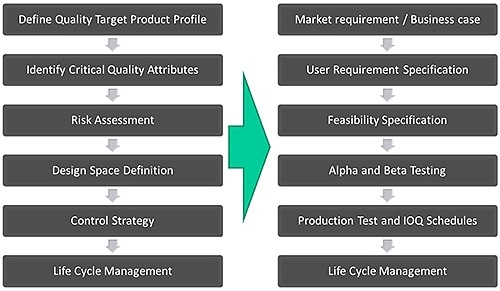
Figure 2. The Malvern Panalytical' product design process closely follows the QbD workflow for pharmaceutical development.
Next, the feasibility of designing a product must be reviewed in order to satisfy the critical requirements identified from the MRS, the user requirement specification (URS). This involves generation of ideas on how the URS needs to be met and determining the critical instrument features that will provide the preferred performance level.
These are the system’s 'Critical to Quality Attributes' (CQAs). Once chosen, these are considered as part of the feasibility specification for product, where the design needed to satisfy the URS is chosen. Methods such as Design for Six Sigma (DSS), Failure Mode Effects Analysis (FMEA), Design for Assembly (DFA) and Design for Manufacture (DFM) are applied. These require that the instrument design is viewed from the perspective of reliable production and delivered performance.
An essential milestone in the feasibility assessment is constructing the first x-model to validate the design concept. The x-model is developed to work similarly to the final product. It allows practical exploration of the technology and performance, however, it may appear different from the final design. After this, an iterative process is performed, during which a number of x-model versions may be built while establishing the design space. This includes a range of acceptability for every CQA.
A number of alpha models are manufactured after all the CQAs are completely understood and the instrument’s design space is improved. At this point, the development process focuses on methods of instrument manufacture to satisfy the specified QTTP. A supply chain is then put in place to offer components for the alpha models that are built for providing the QTTP and to work and appear like the product as it needs to be marketed. Alpha model performance is tested with standard reference samples with specific characteristics and customer samples that apply to the target market. Checks are also performed to make sure that all relevant regulatory needs are met fully.
While developing a control strategy, the second stage involves developing a larger population of beta units. This offers more testing instruments, allows a broader assessment of the manufacturing process, and refines the supply chain. At this stage, any standard operating procedures (SOPs) related to instrument manufacture are finalized, and complete IQ/OQ documentation is provided.
A key element of the second control stage is that instruments are tested with real samples. Malvern Panalytical distributes several beta units to certain customers so that a complete range of 'real-world' samples can be determined using them. This ensures that the instrument can be operated as expected by the users, and can offer acceptable data for different kinds of samples. The successful completion of this stage is marked by a design review sign off, and then the instrument is sent for commercial production.
Based on product complexity and related peripherals, this process from final MRS publication to full product launch can take a number of years. QbD, however, requires an ongoing process of constant improvement, and this marks the end of one crucial stage of the cycle that will continue for the instrument's lifetime.
Developing the Mastersizer 3000 - Launch of New Generation of Laser Diffraction Particle Size Analyzers
Even though all Malvern Panalytical’s products are developed using the above outlined approach, the Mastersizer 3000 laser diffraction particle sizing system has an amazing development story, which is an example of the value of a QbD approach to instrument design.
The Mastersizer 2000, with more than 10 years of production, is an extensively used particle sizing system, and the Mastersizer 3000, launched in 2011, was developed as a direct replacement for that. Laser diffraction is a technique of measuring the angular intensity of scattered light produced by a dispersed sample.
The illumination of a sample by a collimated laser beam causes the large particles in it to scatter light with a very high intensity at small angles, whereas the light is scattered weakly at wider angles by smaller particles (see Figure 3). The particle size data can be determined from a detected light scattering pattern using the Mie theory of light, which offers a relationship between scattering behavior and particle size.
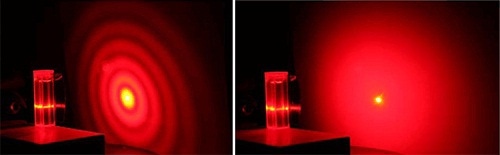
Figure 3. Diffraction patterns for a 5 μm sample (left) and an 800 nm sample (right) show how the light scattering pattern produced by a sample is strongly influenced by the size of particles within it. (Source: Kevin Powers, PERC, University of Florida)
The key considerations when developing a laser diffraction particle size analyzer are to:
- Present a reproducibly and uniformly dispersed sample to the measurement system.
- Enable a broad particle size measurement range, while maintaining a sensible instrument footprint.
- Ensure precise and repeatable measurements as defined in ISO and USP standard documents across the complete measurement range.
From customer feedback and industry analysis, two market requirements were identified:
- Extending both the lower and upper measurement range
- To minimize the instrument footprint
They are the key QTTPs that dictated the Mastersizer 3000’s design.
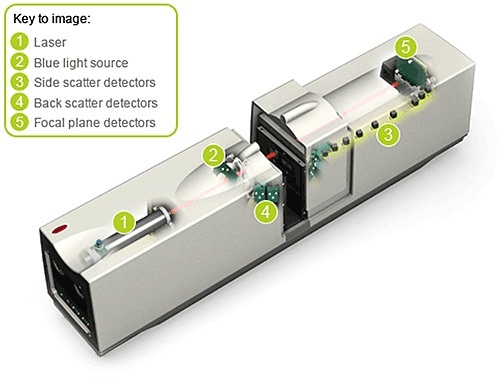
Figure 4. Schematic of the Mastersizer 2000 showing the key components of the instrument.
The measurement range of the Mastersizer 2000 is 20 nm to 2 mm. It makes use of two discrete light sources to provide this performance: a laser providing long wavelength, or red light and a short wavelength, or blue light source (Figure 4). The laser diffraction system length is defined by the upper size limit of detection, and enhancing the upper measurement range to 3 mm with the present Mastersizer 2000 technology would have caused a 30 - 40 cm increase in optical bench length. This is against the QTTP. While assessing the design based on the QTTP, several CQAs emerged for the envisaged Mastersizer 3000.
The CQAs that emerged were:
- Smaller modules/components
- Close tolerance on optical alignment
- Improved sample handling
- Multiple wavelength light sources
- Robustness in all moving components
Smaller Detectors - Critical Advancement
Increasing the detection upper limit of a laser diffraction instrument depends on performing measurements at smaller scattering angles and increasing the optical bench length. Reducing the detector size was very important while developing the Mastersizer 3000. In doing so, an overall decrease in instrument size and a simultaneous measuring range increase are achieved, which help satisfy both QTTPs. In Figure 5, the size reduction that Malvern Panalytical was able to achieve with the new instrument using advanced optics is shown.
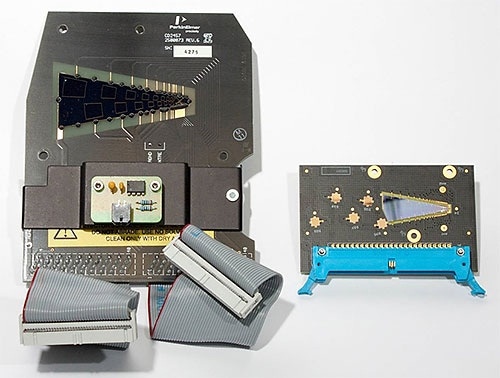
Figure 5. Comparing the size of the focal plan detector for the Mastersizer 2000 (left) with that of the Mastersizer 3000 (right) shows the size reduction that was achieved. Decreasing the detector size satisfies the requirement to shorten the optical bench and increase the upper particle size measurement range.
A new measurement cell locking design was put into place as a result of FMEA analysis to minimize the risk of poor alignment as measurement was being performed at very small angles to the incident beam with a tiny detector. The device developed was tested 17,000 times to develop an optimal design with the required robustness and repeatability.
Incorporation of Two Light Sources
To satisfy the CQA with regards to a number of laser sources, the design included a red laser and a blue LED light source. Particles above 500 nm are measured using the red laser, whereas particles below that are measured using the blue LED light source. With the help of computer aided design (CAD), a theoretical optical design was created to determine the right position of both of the light sources with regards to the light scattering detectors.
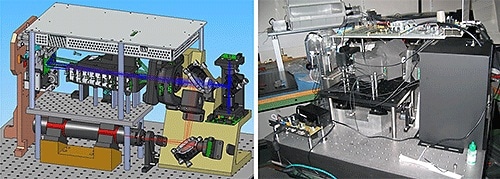
Figure 6. CAD drawn optical bench and x-model prototype. Theoretical and actual results showed good correlation.
While including two light sources, it becomes important to smoothly transition between them. Also, the red gas laser needs to remain on while measurements are being taken with the blue light source.
It was hence important to develop a technique for the prevention of red light transmission through the optical system at the time of measuring with the blue source. It was also important to be able to switch between the two light sources during each measurement to make sure that the measurement was performed successfully across the entire dynamic range. In order to satisfy these functionalities, an innovative shutter design was used. This also satisfied the requirement for more robust moving components.
Building the First Mastersizer 3000
By integrating the new components required to satisfy the challenges related with the QTPPs, first models of the Mastersizer 3000 were developed.
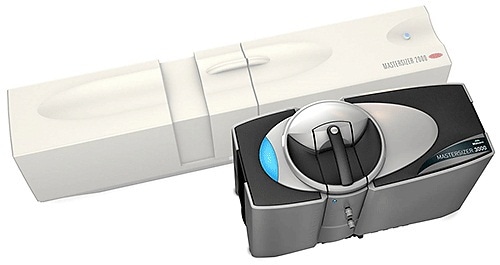
Figure 7. Mastersizer 2000 with its successor, the Mastersizer 3000. A systematic 'QbD' approach allowed designers to increase measurement range while at the same time decreasing the footprint of the optical bench.
These innovations helped design a Mastersizer 3000, which has a high detection range of 10 nm to 3.5 mm and a 690 mm optical bench. It has a footprint 50 % less than that of Mastersizer 2000, with a broader measurement range.
Focusing Attention on Sample Presentation
There was a need for some form of dispersion for most of the samples undergoing laser diffraction particle sizing so that particles were presented in the measurement zone in a relevant or representative state of the bulk powder. The options were dry dispersion or wet dispersion. As part of the development of the Mastersizer 3000, control strategies were put in place to ensure sufficient dispersion with either method. Closely examining the accessory design for wet dispersion revealed how this was attained.
The wet dispersion process involves the following steps:
- Particles are suspended within the sample tank by a stirrer in order to maintain a stable suspension.
- The samples from this suspension are moved down into a pump chamber and pushed towards the instrument’s measurement cell by a centrifugal pump.
- Sonication of the sample is performed by an ultrasound probe placed below the pump in order to promote particle dispersion where needed.
Meeting the QTPP of measurement completely turned attention on this sample introduction mechanism, especially the stirrer and how the design could be made to ensure a uniform suspension and representative sample, even in the case of polydisperse samples.
Figure 8 shows measurements of several samples where the larger seed particle concentration is being slowly increased. This indicates that the stirring mechanism is good as the increase in larger particle concentration causes a linear and corresponding increase in the coarse particle concentration detected. The stirrer produces bias free data.
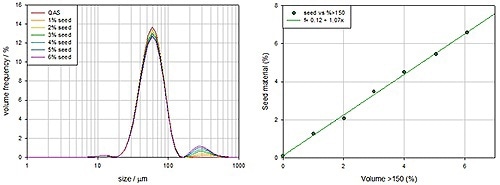
Figure 8. Bimodal distribution of glass beads undergoing wet measurement to test the accuracy of the wet dispersion system.
Large Scale Testing
All the CQAs were well understood and monitored, moving the project completely to alpha and beta production, thus developing more optical benches and instruments for testing purposes. Production testing was performed using a polydisperse glass bead standard, and these properties were compliant with USP and ISO guidance for validating laser diffraction system performance.
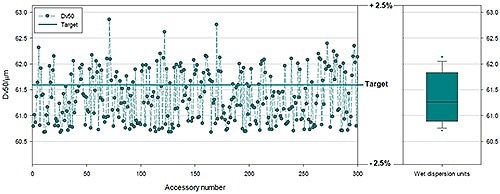
Figure 9. Data showing results produced by 300 different systems using a polydisperse glass bead reference sample.
Table 1. Optical bench data for 300 optical benches tested with a variety of wet dispersion systems. Excellent conformity is achieved between PSD measurements, regardless of the dispersion system used.
| Accessory |
Dv10µm |
Dv50µm |
Dv90µm |
| Average |
% RSD |
Average |
% RSD |
Average |
% RSD |
| Aero S |
38.23 |
0.41 |
62.64 |
0.30 |
89.49 |
0.39 |
| Hydro EV |
36.08 |
0.35 |
60.82 |
0.15 |
88.74 |
0.52 |
| Hydro MV |
36.67 |
0.37 |
61.28 |
0.29 |
89.33 |
0.63 |
| Hydro LV |
36.83 |
0.57 |
61.95 |
0.38 |
89.62 |
0.44 |
| All Wet |
36.53 |
0.99 |
61.35 |
0.81 |
89.23 |
0.67 |
Data from 300 different Mastersizer 3000 systems are shown in Figure 9 and Table 1. These 300 systems were divided into groups of 100, with a different wet dispersion system for each group. Three distinct wet dispersion accessories are included for large volume sampling, the Hydro LV; medium volume sampling, the Hydro MV; and a flexible dip in system for use with standard lab glassware, the Hydro EV in the Mastersizer 3000. The data displayed is for polydisperse samples with a mean particle size of 61.3 µm.
The results show a very good agreement between an RSD and all dispersion systems that confirm high accuracy and precision between optical benches. Tests like this validate that all required controls are in place for all CQAs and show high confidence in the manufacturing processes and the instrument designed.
Conclusion
By adopting a risk assessment-based QbD approach to instrument design, consistency and performance are built into the product right from the start. This knowledge directly translates into an instrument that is not just consistent and complies with regulations but one that is productive, effective and can be used comfortably.
The principle of continuous improvement that forms the basis for the QbD process makes the products adaptable for varying market needs. For instance, a recently launched version of the Mastersizer 3000 software includes an optical property optimizer, which is a tool directly supporting method development. These kinds of software developments continue the process of satisfying evolving customer needs for productive and secure analysis.

This information has been sourced, reviewed and adapted from materials provided by Malvern Panalytical.
For more information on this source, please visit Malvern Panalytical.