In recent years, there has been an increasing demand for batteries thanks to the development of eco-friendly and electronically driven vehicles, and the growing usage of mobile phones, tablets and other portable electronic devices. As a result, the development of new, more powerful and more efficient batteries has become increasingly relevant.
It has already been established as critical to control the size of particles used during the fabrication of battery materials, as well as their shape, because particles that are irregularly shaped tend to reduce packing density and promote the formation of highly viscous electrode slurry.
This article, however, explores the effect of carbon microstructure on lithium-ion (Li-ion) battery performance, and how the Morphologi G3-ID can help in developing and producing new and highly efficient battery electrodes made of carbon.
Lithium-Ion Batteries
The structure of the Li-ion battery is shown in Figure 1. It is a standard battery used to drive portable devices, and generally includes a metal oxide cathode, a graphite anode and an electrolyte, which is a lithium salt mixed in a non-aqueous solvent.
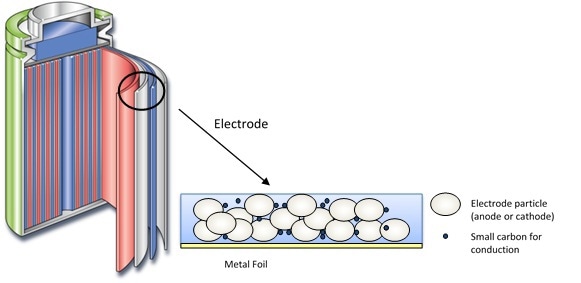
Figure 1. Structure of the lithium-ion battery.
Carbon material is used for manufacturing graphite electrodes for Li-ion batteries. Its crystallinity, micromorphology and microstructure directly affect the efficiency of batteries. In order to charge a battery, an over-voltage is applied through an external power source, thereby forcing the Li+ ions to intercalate within the graphite layers of the anode (Figure 2).
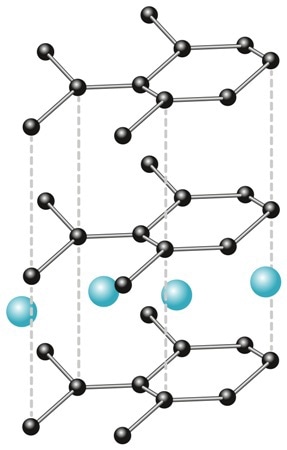
Figure 2. Intercalated graphite.
This intercalation moves the stacking order of the graphite layers, increasing the stacking distance and thus increasing the system’s potential energy. Once the over-voltage is completely removed, the battery will begin to discharge from this high energy state, i.e., the Li+ ions will move out from the graphite layers and transport to the metal oxide cathode through the electrolyte. This cathode advances to a higher oxidation state. This transfer of charge results in current flow, and creates the required electrical energy to power the device.
While the battery’s power relies on the reaction speed between the electrolyte and the electrodes, the energy storage capability relies on the volume of the electrolyte, as well as on the amount of charge that can be stored in the electrodes. In other words, it is important to increase the number of sites on which the Li+ ions can intercalate, and these ions must easily move in and out of the graphite layers. This ensures that the speed at which the charge and discharge reaction occurs is not limited. Hence, it is important that the Li+ ions have good energy storage, and at the same time are efficient at producing the required energy and at being recharged.
The number of sites which are capable of housing the Li+ ions largely depends on the carbon’s microstructure and crystallinity. Graphite with a high crystalline structure will host a single Li+ per C6. Graphite-type structures storing less than one Li+ for every C6 are known as low specific charge (LSC) carbons, whilst those hosting more than one Li+ per C6 are called high specific charge (HSC) carbons.
Highly disordered carbons, such as coke and carbon black, come under the LSC carbons, as the cross-linking carbon sheets in the disordered carbon tend to block the shifting of the stacking layer, which is needed for intercalation of Li+ ions. Greater degree of crystallinity results in the opposite effect. However, it should be noted that the electrochemical behavior of carbon electrodes does not always follow this rule. Both highly disordered carbon and synthetic non-graphite carbons can exhibit high reversibility capacities and HSC carbons, respectively.
Materials and Methods
Raman Spectroscopy of Graphite
Only one Raman active mode (the E2g mode) is observed in pure and crystalline graphite, and only one transition is seen in the Raman spectrum, at approximately 1580 cm-1. This is known as Graphite band, or G band, but when the crystal lattice is not perfect, the selection rules of solid state Raman break down, and an extra mode is seen at around 1310 cm-1 to 1360 cm-1, based on the wavelength of laser. This is referred to as the Disorder band, or D band, and can be attributed to molecular vibrations which become Raman active because of the breakdown of crystallinity.
If the graphite structure is more disordered, the intensity of the D band will be stronger. Hence, it indicates that the G/D band ratio could represent the graphite’s level of crystallinity. it has been hypothesized that if the ratio is higher, the material will be more crystalline. Amorphous carbon does not have Raman transitions in the spectrum determined by the Morphologi G3-ID. Hence, Raman spectroscopy offers a suitable way for defining varied structural forms of graphite.
Morphologi G3-ID
The Morphologi G3-ID is capable of integrating automated static microscopy with an in-built Raman probe, and thus enables the system to chemically and morphologically define a sample. The morphological study reveals the physical and external structure of individual particle, while the chemical measurement gives a description of the internal composition of individual particle, thus allowing a complete identification.
In this analysis, a commercially available graphite sample was first dry dispersed using the automated sample dispersion unit of the Morphologi G3-ID. This unit allows repeatable and reproducible measurement of the sample. An automated image analysis was carried out on 9000 particles in the sample, thereby creating a complete morphological profile that was used for guiding the following Raman analysis. Raman measurement was then carried out on a representative sample of the entire particle population, i.e. a subset of 500 particles.
Following this, each particle structure was evaluated depending on the Raman spectrum it produced, and the level of crystallinity within the particle was subsequently measured. Depending on its degree of crystallinity, each individual particle was assigned a class. In the graphite material, three classes of carbon were present — amorphous carbon, graphite with a degree of disorder, and highly crystalline graphite. This is shown with example particle images in Figure 3.
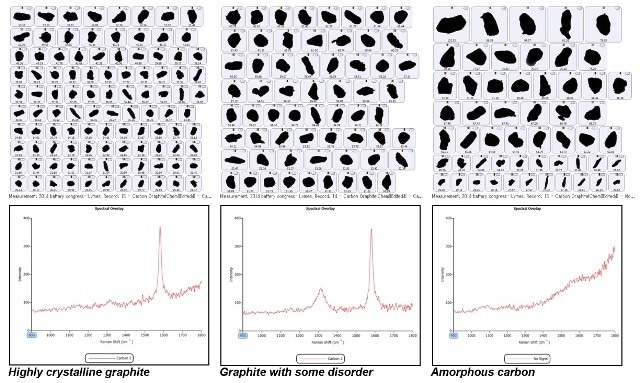
Figure 3. Top - Example particle images for each carbon class; Bottom - Raman spectra associated with the 3 carbon classes.
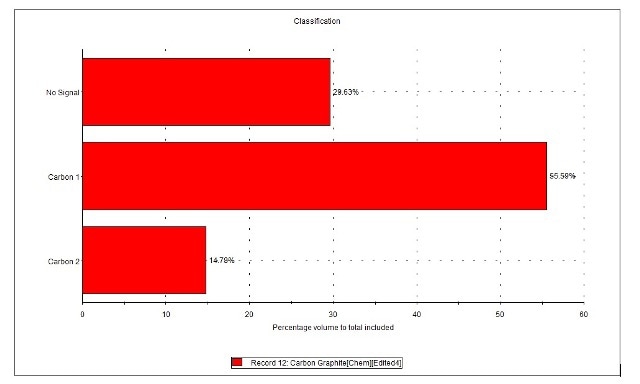
Figure 4. Composition (by volume) of carbon sample in terms of classes identified by Raman spectroscopy.
Over half of the carbon samples contained graphite with a degree of disorder (Carbon 1), as shown in Figure 4. Among this, about 15% was found to be highly crystalline graphite (Carbon 2) and about 30% of the sample was observed to be amorphous carbon, without any Raman signal. Next, the morphological information obtained for all 500 particles studied through Raman spectroscopy was interrogated, as shown in Figure 5 and Table 1.
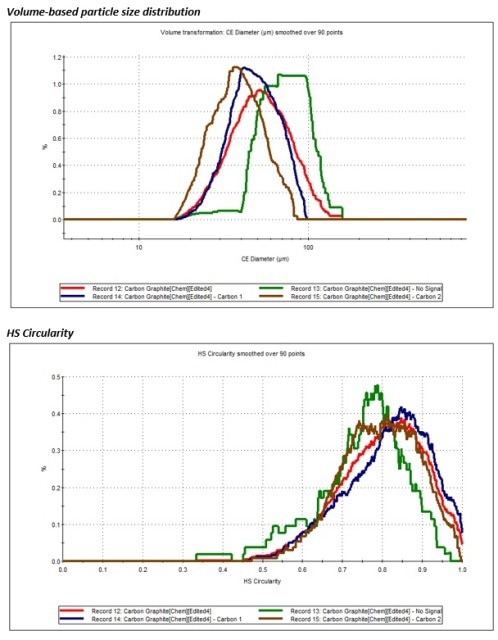
Figure 5. Top – volume-based size distribution of each carbon class identified in the sample; Bottom - HS circularity of the three carbon classes.
Table 1. Summary of size and shape parameters for each carbon class
| Sample Name |
CE Diameter Mean (µm) |
HS Circularity Mean |
| No Signal (amorphous carbon) |
53.35 |
0.746 |
| Carbon 1 (disordered graphite) |
42.21 |
0.811 |
| Carbon 2 (crystalline graphite) |
33.99 |
0.792 |
Based on these results, the highly crystalline graphite particles (Carbon 2) had the smallest average particle size, while amorphous carbon had a large particle size, but with the lower circularity when compared to other two carbon classes. This morphological data regarding the different classes of carbon may be used to detect and filter off the preferred carbon particles for the fabrication of Li-ion batteries, which demand the more ordered, crystalline graphite. It is also possible to apply this data to measure the source of the commercially available graphite. For instance, mined carbon has more crystalline graphite, while carbon produced from acetylene oxidation is rich in amorphous carbon.
Conclusion
This article has shown how the Morphologi G3-ID’s integrated Raman probe can be effectively used for detecting different classes of carbon within a sample of graphite-based battery electrode. This data, in combination with the morphological information acquired from the same method, facilitates the development and manufacture of battery electrodes in a cost-effective and time-efficient manner.

This information has been sourced, reviewed and adapted from materials provided by Malvern Panalytical.
For more information on this source, please visit Malvern Panalytical.