High-throughput screening and identification of candidate biotherapeutics can be performed through versatile and commonly-used methods such as Surface Plasmon Resonance (SPR) and Bio Layer Interferometry (BLI). The high-throughput SPR involves identifying molecules as key targets that are immobilized on a chip. However, the BLI allows immobilization of targets or candidates on fiber optic probes, which are then dipped into microwells with solutions of the opposing molecules. As a result, one or more candidate therapeutic molecules with beneficial properties like rapid binding kinetics and high affinity can be chosen from a screen.
Testing of Candidate Biotherapeutics
Dozens to hundreds of candidate biotherapeutics can be tested in the typical screen. For this reason, several high-throughput SPR instruments are designed to draw samples from standard microwell plates before injecting them into microfluidic channels. The analyte is allowed to flow over the immobilized target molecule where good candidates are present on the chip surface through specific association with the target epitope. BLI also involves a similar process, except that no microfluidics are involved. A signal is then generated that is proportional to the increase in surface-bound mass through an optical probe. The analysis of these signals, with respect to multiple analyte concentrations, provides affinity and kinetics.
Sample quality is one of the parameters that hinder effective candidate selection. The measurements are severely affected in two ways by the purity and solution properties of molecules used in SPR and BLI screening. These are: 1) data quality, and 2) microfluidic integrity.
However, there is a versatile tool which readily addresses the sample quality analysis. The protein quality is measured by high-throughput dynamic light scattering (HT-DLS) with the Wyatt DynaPro Plate Reader II (Figure 1) without disturbing the solution. The measurements are carried out in the same microwell plates that are used by high throughput discovery screening platforms. Additionally, DLS can also determine the diffusion coefficient of analyte.
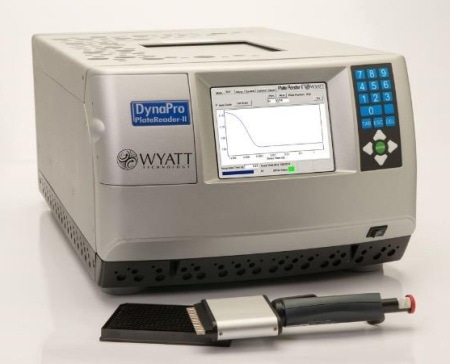
Figure 1. The DynaPro Plate Reader II assesses solution quality in standard 96, 384 or 1536 well plates, without perturbing the samples.
Significance of Analyte Quality I: Impurities
Analyte quality, which is often ignored, is a critical parameter which helps in achieving precise measurement, leading to the selection of appropriate therapeutic candidates and thus providing accurate results. Low molecular weight impurities, including extractables and leachables, generally have a low impact on SPR and BLI measurements. Large impurities, like aggregates and foreign particles can, however, affect the measurements by both techniques.
A signal spike which is approximately in proportion to the mass of a nanoparticle or aggregate is generated as the particle passes a distance of few hundreds of nanometers from the surface of the chip or fiber probe.
With the presence of large quantities of smaller nanoparticles and aggregates in a low quality sample, a steady stream of small signal fluctuations is produced, resulting in a degraded optical response. Figure 2 shows the simulated sensorgrams of both the effects.
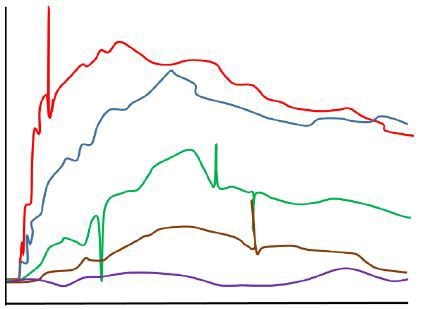
Figure 2. Sensorgram obtained in the presence of aggregated analyte (simulated).
Analyte aggregates may or may not be active. If active aggregates are present in considerable quantities (e.g., > 5% total analyte protein mass), they bind to the immobilized ligand and produce an SPR or BLI signal, which is greater than that of the anticipated monomeric interaction.
For inactive analyte aggregates, the effective concentration will be lower than the measured total concentration, resulting in reduced binding, and an apparent decrease in affinity. Aggregates can, either way, lead to the improper quantification of candidate binding properties (Figure 3).
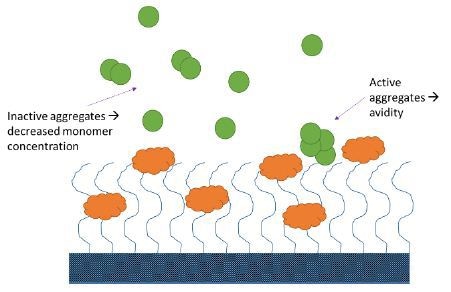
Figure 3. Aggregates may impact SPR and BLI measurements in several ways.
Significance of Analyte Quality I: Self-Associating Analyte
The requirement of standard SPR and BLI analyses is that the analyte needs to be monomeric in solution at the concentrations used in the experiment. The extreme impact of irreversibly aggregated material on the analysis is addressed in the previous section.
Poorly formulated or otherwise ‘sticky’ analytes can self-associate reversibly as well as irreversibly. In such cases, the analyte monomer is in dynamic equilibrium with small oligomers, including dimers or tetramers, while the actual monomer concentration differs with protein concentration.
The activity and presentation of binding sites influence the effect of the final measurement. The active oligomers can result in overestimates of affinity, and inactive aggregates can produce underestimates (Figure 4). In addition, presentation of multiple binding sites can cause avidity effects and gross overestimates of affinity.
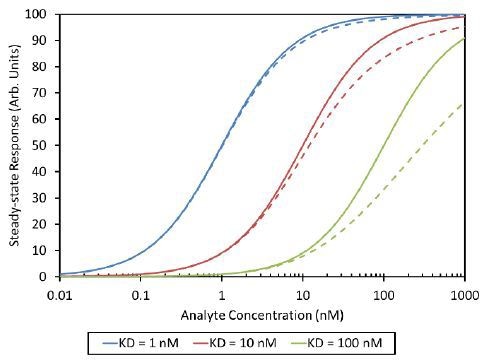
Figure 4. Analyte self-association with Kd= 100 nM can shift the apparent analyte-ligand equilibrium isotherm from the expected curve (solid line) to the measured curve (dashed line). In this analysis the dimer was assumed to be inactive.
Significance of Substrate Protein Quality
Most of the aggregated analytes can cause experimental errors, like aggregated immobilized proteins. The presence of protein aggregates on the chip or fiber probe surface can particularly cause decrease of the active material or reduction in the average number of exposed epitopes per immobilized mass. As a result, the apparent affinity can be reduced by aggregated substrate proteins.
Drain Plugger
Extremely aggregated, or otherwise impure, material carrying large particulates can cause another effect i.e. clogged microfluidics in multichannel SPR. These fluidic channels may be narrow but long, and are susceptible to plugging by agglomerated proteins or other ‘nanocrud.’ The effects of protein expression, purification and preparation can be affected by the occurrence of clogging events in the midst of a screen of dozens or hundreds of candidates.
Plugged microfluidics can be recovered by simply replacing a chip or by using a lengthy system of cleaning and maintenance. The damages, if any, may account to several thousands of dollars.
Application of Dynamic Light Scattering
Dynamic Light Scattering (DLS) is a non-invasive, nonperturbative optical method used for measuring nanoparticle size distribution in solution/suspension, ranging from less than 1 nm up to several micrometers. DLS is based on the Brownian motion principles to determine the particles’ diffusion rates in solution.
DYNAMICS® software is used to transform the information into particle size distribution. The particle size distribution is then evaluated to determine if SPR microfluidics can be safely injected with the solution, and if the SPR or BLI measurements will generate reliable results.
The whole process can be quickly carried out before loading it onto the interaction apparatus. The loading is performed by placing the microwell plate into the DynaPro HT-DLS system, running the sample screen, and transferring the same microwell plate onto the SPR or BLI instrument.
Because of Brownian motion, molecules and nanoparticles in solution or suspension tend to jitter. At different phases, the light waves scattered by a number of nanoparticles hit the detectors. As a result, they interfere constructively or destructively at the detector based on the presence of specific phase difference between them (Figure 5).
Figure 6 shows the transformation of diffusion coefficients to particle sizes via the Stokes-Einstein equation: Rh=kBT/6πηDt, where kB is Boltzmann’s constant, Rh is the particle’s hydrodynamic radius, η the solvent viscosity, and T the absolute temperature.
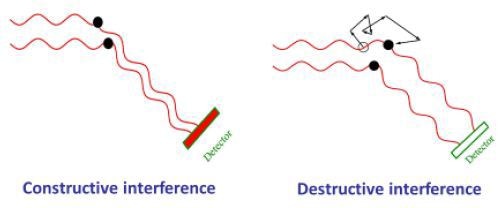
Figure 5. As molecules move through Brownian motion, the light scattered from each molecule traverses a different path. This leads to constructive or destructive interference at the light scattering detector. When scattered waves interfere constructively, the DLS detector records high light intensity; conversely when waves interfere destructively, the detector records low light intensity.
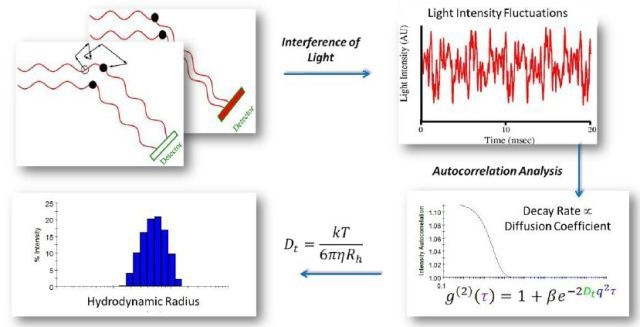
Figure 6. Autocorrelation analysis is the mathematical transformation linking light intensity fluctuations to the diffusion coefficient. Following autocorrelation, DYNAMICS converts the diffusion coefficients to size.
Three typical %-intensity size distributions determined by DLS are shown in Figure 7. The red and blue curves are due to monomodal populations of BSA (Rh = 4 nm) and polystyrene spheres of radius 50 nm, respectively. The green curve is due to a solution containing high quantities of monomeric protein, Rh ∼ 4 nm, and some large aggregates with Rh of about 50 nm.
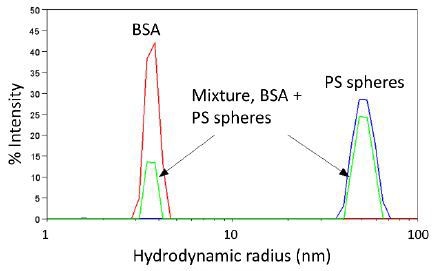
Figure 7. Representative size distributions determined by DLS.
Assessment Using HT-DLS
Conventionally, DLS is performed manually in a microcuvette, one sample at a time. Not all of the hundreds of candidates can be screened in this way. The DynaPro Plate Reader II, however, reflects the capabilities of HT-DLS to perform quality assessment for the target and all the candidates. This is due to its microwell-plate based format with in situ, non-perturbative measurements.
The DynaPro avoids the limitation of potential carryover of samples between the wells. The time taken for measurements can vary between 10 s and 30 s per well, including transition time between wells.
DYNAMICS, when used in HTS-DLS applications, is configured to hold the data as a heat map depending on poor, intermediate and high quality size distributions with respect to bin definitions specified by the user. For instance, a sample with a single, narrow peak, at a size related to that of the analyte, can be classified as high quality and allowed to further move to the binding assay with high confidence (Figure 8, red wells).
An adjoining sample showing a broadened monomeric peak, indicating some oligomers and lower levels of additional particulates, can be classified as intermediate quality and allowed to move, but with a warning flag as to confidence in the results (Figure 8, blue wells).
A sample with significant particulate content in the micron-size range can be either contaminated or susceptible to aggregation (Figure 8, black wells).
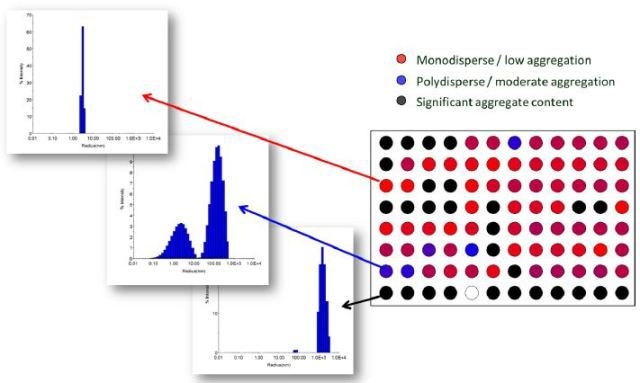
Figure 8. Visualization of protein quality via heat map in DYNAMICS. Total data acquisition time for 96 wells was < 45 minutes. Data courtesy of Sabin Vaccine Institute and Texas Children’s Hospital Center at Baylor College of Medicine.
Additional Benefits of DLS
As an added bonus, DLS inherently determines diffusion coefficients which are helpful in assessing mass transfer effects. Another unique feature of the DynaPro Plate Reader II is the built-in, high-magnification camera which snaps a picture of each well after taking a DLS measurement.
These images, stored and shown with the associated DLS data, are especially helpful as diagnostics. Figure 9 shows additional examples of sources of poor data identified by camera images. Finally, the same microwell plates used in the DynaPro may be transferred to a spectroscopic plate reader for additional confirmation of content and quality.
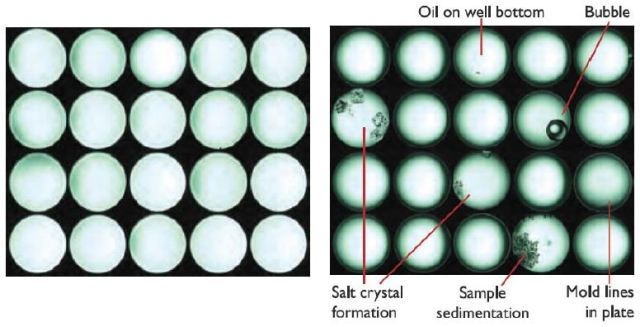
Figure 9. The DynaPro's on-board camera helps identify wells containing clean solution and those where sample has precipitated or otherwise can be expected to provide poor data quality.
Sensitivity
Every technique and instrument has concerns associated with sensitivity. The DynaPro has the lower detection limit of 0.125mg/mL lysozyme (M = 14.4kDa). The sensitivity is inversely proportional to molar mass as the intensity of light scattered by macromolecules is related to molar mass. The same trend can also be observed in sensitivity to aggregates.
Even when the primary sample concentration is within the detection limit, DLS can be used for quality assessment due to its excellent sensitivity to the ‘nanocrud’ content - sub-micron particulates and large protein aggregates that are harmful to the binding analysis and microfluidic system.
Conclusion
This article concludes that candidate molecules can be selected with the potential for optimal therapeutic effect and patient benefit with respect to a reliable target binding screen, as carried out with SPR or BLI.
The high-throughput dynamic light scattering offered by the DynaPro Plate Reader II can be applied in the screening work flow to classifying solutions as high quality to offer maximum confidence in the interaction analysis, intermediate quality for measurements that require caution, and low quality inappropriate for analysis, and potentially fouling the measurement device.
The addition of HT-DLS pre-screen can avoid uncertainty and productivity loss related to variable ligand quality. This can result in reliable binding data and confidence on the selection of final candidate.
Reference
Adapted from "Protein Quality Control in SPR and BLI High-Throughput Screening Studies" white paper by Wyatt Technology. Graphs and illustrations reprinted with permission from Wyatt Technology.

This information has been sourced, reviewed and adapted from materials provided by Wyatt Technology.
For more information on this source, please visit Wyatt Technology.