It is estimated that there is in excess of 150 million tons of plastic materials in the world’s oceans. Much of this pollution consists large items such as plastic bags and discarded drink bottles. There is another set of research activities covering much smaller materials called microplastics, which are polluting rivers and ocean systems and present a totally different kind of problem for aquatic life.
What are Microplastics
Microplastic beads are used as abrasive materials in several cosmetic products, such as toothpastes, shower gels and facial scrubs. These beads are sub-millimeter in size, and are washed down the sink into the sewage systems. Sewage treatment plants are unable to filter out these microplastic beads as they are so tiny, and thus these beads flow into the river systems and eventually end up in the oceans. Subsequently, fish and marine organisms swallow these microplastics, and finally wind up in the human food chain. The US has banned the use of microplastics in any cosmetics. Most of the cosmetic companies have voluntarily taken measures to phase out the use of microplastics.
Infrared (IR) Spectroscopy
IR spectroscopy is a proven method for determining polymer materials. It has been used widely for identifying large polymer materials measuring over 100µm. The Spectrum Two™ is a type of transportable FT-IR spectrometer, which can be operated from a battery pack, therefore can be used on boats to instantly identify these polymers. An IR microscope is capable of detecting and identifying microplastics measuring as small as a few micrometers.
Experiment Using Spotlight™ 200i IR Microscope
The Spotlight™ 200i IR microscope system was used to test two commercially available products to establish if microplastics were present as an exfoliant agent, and to classify the type of plastics used. The first product chosen for this experiment is a facial scrub. The second product is a body scrub. Both products were dissolved in hot water for dissolution of the soluble ingredients.
To capture any insoluble ingredients measuring more than 50µm in size, the solution is strained through a 50µm filter. Then the filter is allowed to dry before IR microscopy measurements are carried out. Measurements were carried out on the samples both directly on the mesh as well as after the residual particles were moved to an IR transmitting window on a microscope holder. Figures 1 and 2 show the visible images of the microplastics that were collected.
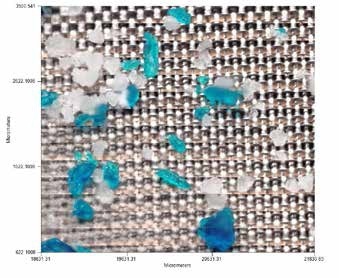
Figure 1. Microplastics in Product 1 (facial scrub) collected on mesh.
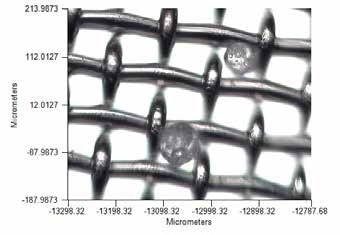
Figure 2. Magnified view of microplastics collected from Product 2 (body scrub).
The images reveal that product 1 (facial scrub) contained uneven-shaped microplastics with two different colored particles. Likewise, the 2nd set of images showed that product 2 (body scrub) contained evenly shaped spheres with a diameter range of 50-80µm.
Infrared spectra of these particles can be measured in reflectance or transmission on the IR microscope. Figure 3 shows the spectra measurement of particles in Figure 1, in-situ on the mesh. The transmission spectrum has a much higher signal than the reflectance spectrum and gives better sensitivity for this measurement. In addition, the bands in the reflectance spectrum are more intense due to the fact that the IR beam is effectively passing twice through the sample, known as transflectance.
This does not cause any problem to smaller particles. However, the path length is very large for larger particles, resulting in totally absorbing bands and posing difficulty in their identification. Nevertheless, it would still be feasible to identify the material from either the reflectance or transmission spectrum. There is a chance that the mesh could obstruct the transmission measurement, causing a minimal reduction in the amount of energy reaching the detector. The baseline slope seen in the spectrum is due to this factor. However, there is no radical impact on the general measurement.
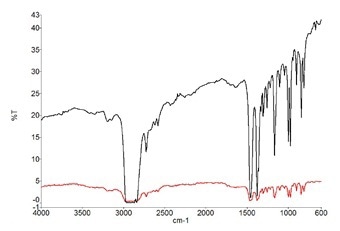
Figure 3. Spectra from a microplastic particle in Product 1. Transmission spectrum (black) and reflectance spectrum (red)
To achieve excellent quality spectrum of the material, it is recommended that the sample be placed onto an IR-transmitting window material, such as potassium bromide (KBr). This can be done by placing a KBr window on the mesh containing the sample. Then, the mesh is inverted, causing the microplastic particles to be transferred directly onto the KBr window. A visible image survey was collected from the area holding a vast amount of particles in Product 1.
Using the “analyze image” feature of the Spectrum 10 software causes the smart automated routine to detect particles within the visible image survey, which is illustrated as “analyze image result” (Figure 4).
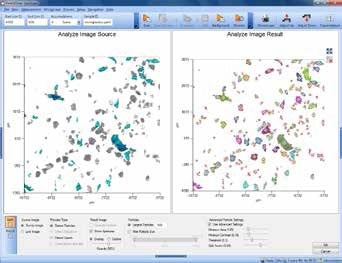
Figure 4. The Analyze Image software routine detects the particles in Product 1.
The automated routine is capable of detecting any particles in the visible image and marking them as areas of interest. Then, the maximum rectangular aperture size is calculated that can fit completely within each particle. As a result, signal-to-noise is optimized during data scanning.
Previously, setting of apertures and selection of the areas of interest manually were a time-intensive process. Transmission spectra are collected by selecting “Scan Markers,” utilizing equivalent apertures for the background for each particle. As a result, ratioed sample spectra are displayed in real time when they are acquired. Using software functions, such as search, compare, or verify, automatic spectra processing can be conducted during data collection.
For the investigation of the microplastics, a spectral search was conducted against a library of polymer spectra to provide the identity of all the particles in the results screen (Figure 5).
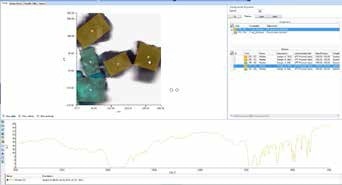
Figure 5. Results screen for the detection and identification of particles.
The results revealed that product 1 contained two types of polymers - polyethylene and polypropylene. Product 2 contained only polyethylene. Representative spectra are illustrated in Figure 6. Minor differences were noticed in the polyethylene spectra between the two products. This could be due to the presence of additives.
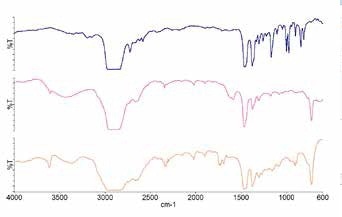
Figure 6. Top – spectrum of polypropylene in Product 1. Middle – spectrum of polyethylene in Product 1. Bottom – spectrum of polyethylene in Product 2.
Conclusion
Environmental impact due to microplastics is a growing concern and their use in consumer products is increasingly being banned. From the results, it has been proved that automated IR microscopy is an invaluable technique for the detection and identification of the source of microplastics in cosmetics.

This information has been sourced, reviewed and adapted from materials provided by PerkinElmer.
For more information on this source, please visit PerkinElmer.