Laminates or multilayer polymer films are used for a wide range of industrial applications including food and consumer product packaging. Multilayer films used for packaging have a complex composition in order to preserve their contents. The packaging needs to protect the product, which requires strength, and must also be machineable at low costs.
Each one of the laminate layers perform a unique barrier function for protecting the contents from external influences such as oxygen, light, moisture, other chemicals and microbial materials. Typically, conventional polymers used for packaging include polypropylene (PP), polyethylene terephthalate (PET), polystyrene (PS) and polyethylene (PE).
These packaging materials account for a significant proportion of materials ending up at landfill sites or recycling plants. Some of these materials biodegrade slowly or do not biodegrade at all and are environmentally unfriendly. Therefore, the preference for using compostable or biodegradable polymers for packaging is increasing steadily.
Compostable materials are partially or completely made up of starch, cellulose or polyactic acid (PLA). The majority of bioplastics are degradable though this is not always the case. Compostable plastics are entirely biodegradable and are broken down by microorganisms which produce water, biomass and carbon dioxide. Such materials are more eco-friendly and are expected to be used increasingly in the future.
Infrared microscopy is a common technique for the characterization of multilayer polymers. Even small samples with a size less than 10µm can be identified using an infrared microscope and the individual layers of a laminate can also be observed. This article elaborates on the application of infrared microscopy to conventional multilayer polymer films and new compostable materials.
Analysis of Multilayer Polymers using Infrared Microscopy
Transmission or Attenuated Total Reflectance (ATR) methods are used to perform infrared microscopy on polymer films. Optically thin samples with a thickness less than 20 to 30µm are required for this method. A microtome is used to convert the samples to thin films.
For measuring the transmission spectra, the prepared sample should be placed on an infrared transmitting window like potassium bromide (KBr). For ATR measurements on thick materials, the sample should be supported physically by positioning it in a sample clamp designed for infrared microscopes or by embedding in a resin. A notable advantage of ATR measurements is the ability to generate spectra with an improved spatial resolution compared to transmission measurements.
Transmission of Laminate
With the help of a microtome, the polymer laminate sample was trimmed to a thickness of 25µm and fastened to a KBr window of 7mm diameter. This arrangement was mounted to a standard microscope holder on the microscope stage of the PerkinElmer Spotlight™ 200i. The image of the sample is shown in Figure 1.
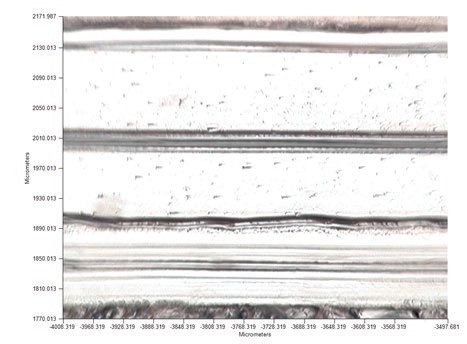
Figure 1. Visible image of the polymer laminate measured in transmission
The laminate measured 350µm across. For in-depth data of each laminate layer a linescan was set up for the collection of spectral data very small intervals across the laminate. The experimental set up for the linescan yielded 140 spectra for an aperture size of 5µm, and measurements were taken at 3µm intervals. Figure 2 shows the linescan data.
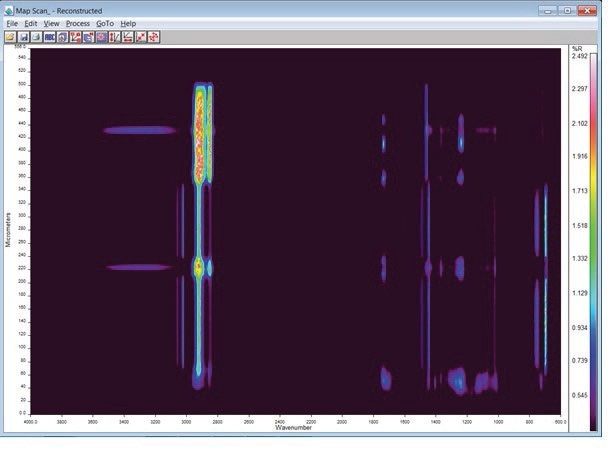
Figure 2. Linescan data for polymer laminate transmission measurements
The results depicted in Figure 3 show the presence of many different types of polymers in the sample.
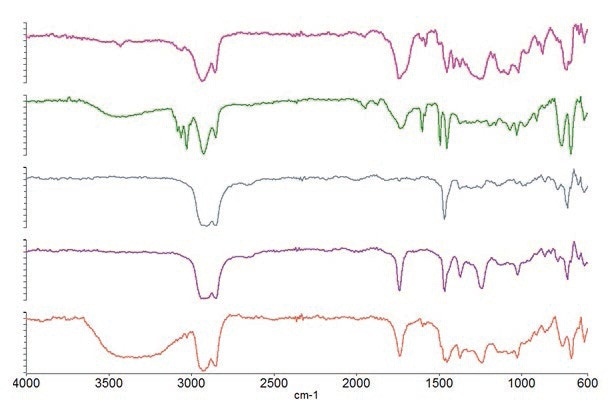
Figure 3. Spectra of the polymers present in different laminate layers.
By using search libraries, the polymers were identified as PE, ethylene-vinyl acetate (EVA), PET, modified PS and ethylene-vinyl alcohol (EVOH). Profiles can be generated that demonstrate the distribution of various polymers across the laminate to provide further structural information.
Figure 4 shows the profiles for the identified polymers: polyethylene – 1450cm-1, polystyrene – 1600cm-1 ethylene-vinyl acetate copolymer – 1746cm-1 and ethylene-vinyl alcohol copolymer – 3334cm-1.
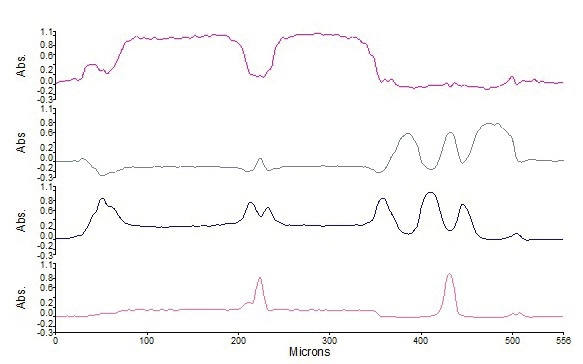
Figure 4. Distribution of polymer types in laminate. From top to bottom polystyrene, polyethylene, ethylene-vinyl acetate copolymer and ethylene-vinyl alcohol copolymer.
The Analyze Image function of the Spectrum 10 software can be used for experiments that need only detection and identification of layers in the laminate. The analysis of the visible image of the sample, detection of the layers and increasing the measurement area of each layer can be performed automatically by the Analyze Image function.
For multilayer samples a single spectrum is collected for each layer with a maximum signal-to-noise ratio and a substantial reduction in the analysis time in comparison with mapping or linescan techniques. A five-layer laminate is depicted in Figure 5.
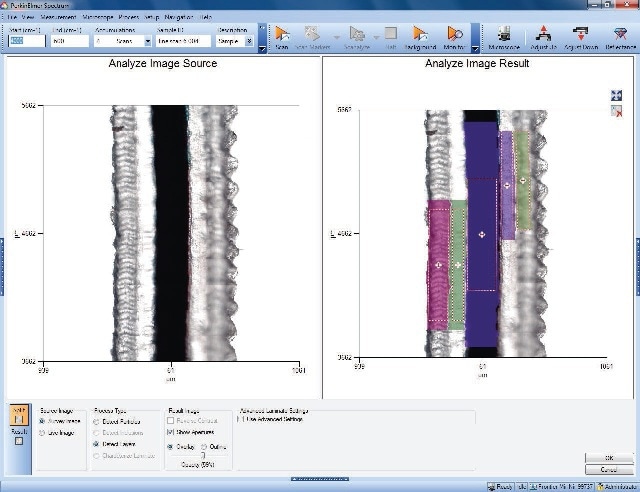
Figure 5. Automatic detection of layers in a laminate shows five layers.
Figure 6 shows automatic recording of the spectra at marker positions following the detection of laminate layers.
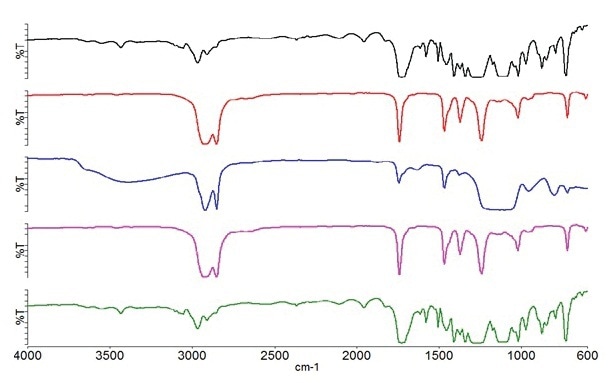
Figure 6. Spectra layers 1 are shown (top) to 5 (bottom) in polymer laminate.
Identification of each of the layers was done with the help of an automatic library search. Layers 1 and 5 were polyethylene terephthalate, layers 2 and 4 were ethylene-vinyl acetate copolymer and layer 3 was silica-loaded polyethylene.
ATR Measurement of Polymer Laminates
The ATR measurement is a simple and fast method for measuring the infrared spectrum of a material. Spectra of extremely small materials with sizes in micrometer ranges can be measured through the ATR technique in infrared microscopy.
For gathering the information on food packaging laminates, a macro ATR crystal/accessory is mounted on the microscope. This accessory is capable of generating spectra with a much better spatial resolution in comparison with transmission measurements.
The samples were prepared by embedding in resin and polished to a flat, uniform surface before taking ATR measurements. This method of sample preparation is better than simple clamping of the sample because it provides a strong multilayer surface and avoids any compression of deformation of the sample when ATR pressure is applied.
A sample of a multilayer food package manufactured using “traditional” polymers was prepared for ATR measurement in the Spotlight 200i. The visible image of this sample was measured and is shown as Figure 7. The width of the laminate is seen to be approximately 200 micrometers and consists of several polymer layers.
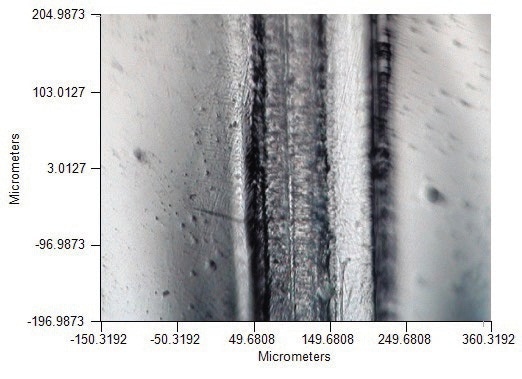
Figure 7. Visible image for multilayer packaging material.
The macro ATR crystal for the IR microscope was placed in contact across the entire width of the sample. Spectra were collected across the laminate with an effective aperture size of 5 x 5 micrometers at a step size of 5 micrometers. The linescan data collected is shown as Figure 8.
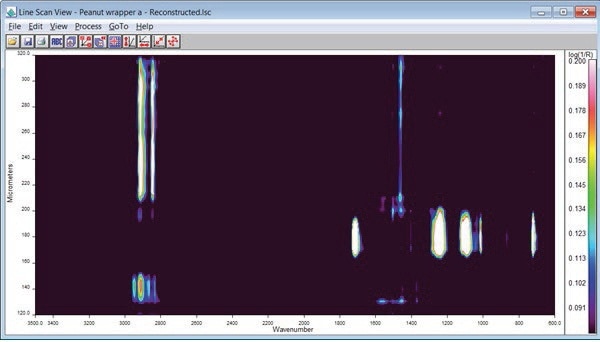
Figure 8. Linescan data for food packaging material.
Figure 9 shows the spectra recorded for the main layers.
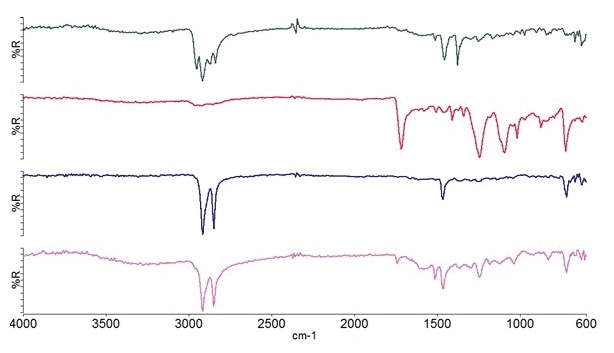
Figure 9. Spectra of major layers are identified as PP,PET, PE and modified PE.
The layers were identified as polyethylene, modified polyethylene, polypropylene and polyethylene terephthalate by conducting a search in the polymer database. Apart from these main layers, several minor layers were also detected, and the corresponding IR spectra of the minor layers are shown in Figure 10.
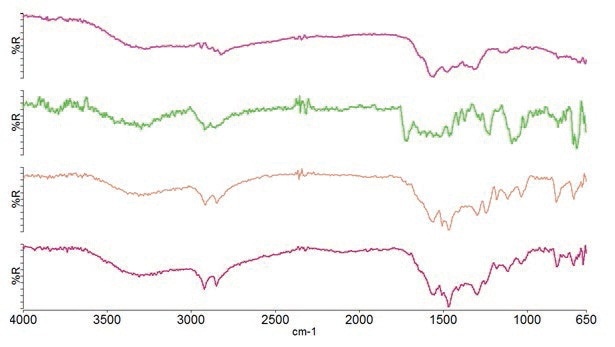
Figure 10. Spectra of minor layers in multilayer food packaging material.
The image shows that a specific portion of the data, which covered 160µm in the image, did not provide any spectral details because it was a thin foil layer.
Biodegradable polymer materials are slowly replacing conventional packaging material. Compostable packaging was analyzed using the Spotlight 200i. The sample preparation for compostable material was similar to the method followed for conventional polymers. Figure 11 shows a visible image of the compostable sample.
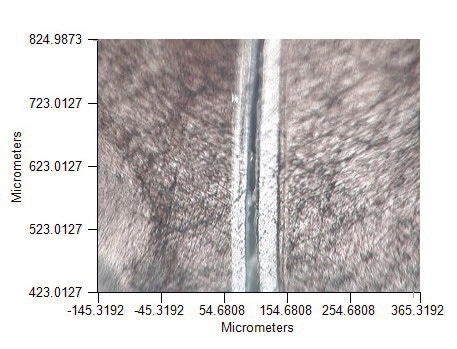
Figure 11. Visible image of the compostable food packaging material.
It can be seen that the laminate is roughly 80µm in width with a few visible layers. The IR data is shown in Figure 12. There are three main layers in the laminate, each measuring 25µm in width roughly. The spectrum is shown in Figure 13.
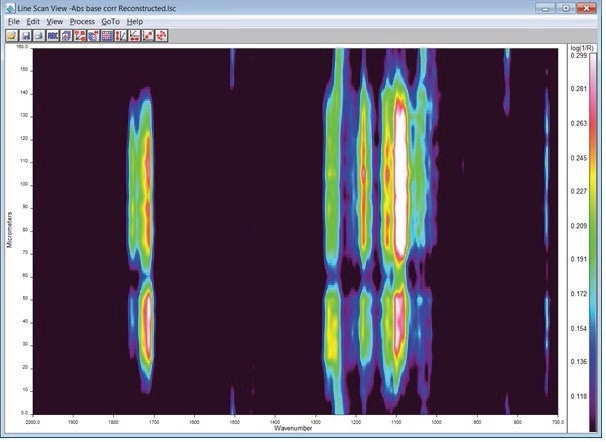
Figure 12. Linescan data for compostable laminate sample.
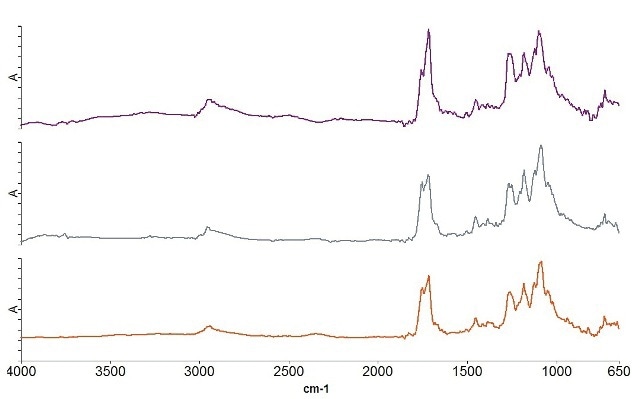
Figure 13. Shown here are spectra of the three different layers in the compostable polymer laminate.
All three layers exhibit similar spectra, but a spectral difference is observed in the C=O region that spans from 1700-1760 cm-1. The materials were identified as polylactic acid (PLA)-based copolymers. A region spanning approximately 60µm in the display did not show spectral features due to the presence of a thin foil layer.
Conclusion
Packaging materials, especially those used for food packaging, are complex. Multilayer laminates are especially suited for food packaging requirements. The disadvantage of using food packaging materials is their non- biodegradability. As a result, new biodegradable polymers are becoming more desirable. These multilayer materials can be effectively characterized through IR microscopy techniques. Transmission or ATR measurements can easily be deployed depending on the sample preparation that is available.

This information has been sourced, reviewed and adapted from materials provided by PerkinElmer.
For more information on this source, please visit PerkinElmer.