Low alloy steels (LAS) are widely used for the production of aerospace and automotive parts, onshore and offshore structural engineering plates, pipes and railway lines. Low alloy steels typically contain less than 10% of alloying elements. These elements include C, Cr, Mo, Mn, Ni, Si and V.
High-strength low alloy steel has excellent resistance to corrosion and is used extensively in the automotive and aerospace industries. During steel production it is important to be able to carry out fast and precise elemental analysis. This not only allow steel producers to reduce costs in today’s competitive markets but also enables them to meet required quality standards.
With regard to flexibility and speed in analysis, pre-calibrated Zetium sequential XRF systems are available with a LAS package. The system is pre-calibrated with 90 certified reference materials for instrument drift and sample preparation correction. This means LAS samples can be analyzed as soon as the system is installed.
The LAS package can meet different power configurations spanning from 2.4, 3 through to 4 kW. For existing spectrometers (MagiX PRO and Zetium), the LAS calibration module can be delivered after validating their compatibility.
Instrumentation
Zetium wavelength dispersive XRF spectrometers are equipped with a SST R-mAX tube, 2.4 kW Rh anode, advanced SuperQ software and an X-Y sample handler was used to perform analyses. The software has a sophisticated Fundamental Parameters (FP) algorithm. Designed for excellence the Zetium system provides good operational performance and analytical precision.
Standards Used and Sample Preparation
Over 90 certified reference materials were used to set up the LAS calibration. These materials were sourced from the following suppliers:
- The Willan Metals institute
- The National Institute of Standards and Technology (NBS-series)
- Bureau of Analyzed Samples (BCS- and SS- series)
- The European Coal and Steel Community and the MBH Analytical LTD (ECRM series)
The Zetium systems were pre-calibrated. This was done by transforming the master calibration using 6 certified reference materials (Table 1) by means of the SuperQ calibration update.
Table 1. Calibration update standard
| Identification name |
| SPL LA-3E |
| SPL LA-4B |
| SPL LA-5B |
| MBH 12X 355 |
| CKD 183B |
| CKD 185A |
Carbon is a major element in LAS. To calibrate and analyze this element content, a circular grinder with 60 grit Al2O3 sandpaper was used to re-surface the standards before each analysis.
These samples were obtained from SUS Ullrich Nell, as shown in Table 2, and come with the LAS calibration to adjust for different methods of sample preparation and instrument drift.
Table 2. Elemental composition of the instrument monitor samples
| Elements |
SUS RM Fe 2/2* |
SUS RM Fe 1/4* |
SUS RM Fe C/2* |
SUS RM Fe D/7* |
| Average (%) |
ASD (%) |
Average (%) |
ASD (%) |
Average (%) |
ASD (%) |
Average (%) |
ASD (%) |
| C |
0.309 |
0.002 |
0.008 |
0.0003 |
0.14 |
0.0006 |
0.85 |
0.0041 |
| Si |
0.325 |
0.0026 |
0.016 |
0.0017 |
0.53 |
0.0014 |
1.05 |
0.008 |
| Mn |
0.457 |
0.0017 |
0.068 |
0.0003 |
1.29 |
0.003 |
0.22 |
0.0061 |
| P |
0.047 |
0.0006 |
0.006 |
0.0002 |
0.87 |
0.0002 |
0.022 |
0.0005 |
| Si |
0.01 |
0.0007 |
0.005 |
0.0002 |
0.072 |
0.0023 |
0.011 |
0.0014 |
| Cr |
0.604 |
0.0017 |
0.027 |
0.0003 |
0.38 |
0.0005 |
2.93 |
0.0303 |
| Mo |
0.293 |
0.0014 |
0.0016 |
0.0001 |
0.21 |
0.0005 |
1.22 |
0.0073 |
| Ni |
0.906 |
0.0022 |
0.022 |
0.0002 |
0.41 |
0.0012 |
0.12 |
0.0023 |
| Al |
0.0044 |
0.0006 |
<0.002 |
|
0.005 |
0.0002 |
0.16 |
0.0019 |
| Co |
|
|
0.0029 |
0.0001 |
0.11 |
0.0013 |
0.32 |
0.0015 |
| Cu |
0.309 |
0.0036 |
0.015 |
0.0001 |
0.68 |
0.0001 |
0.05 |
0.0015 |
| Nb |
|
|
<0.0005 |
|
0.0073 |
0.0001 |
0.3 |
0.0035 |
| Ti |
0.013 |
0.0003 |
<0.0005 |
|
0.0074 |
0.0001 |
0.12 |
0.0016 |
| V |
0.31 |
0.0022 |
<0.0005 |
|
0.073 |
0.0002 |
0.05 |
0.0009 |
| W |
|
|
<0.0001 |
|
0.34 |
0.0057 |
0.05 |
0.0043 |
| Pb |
|
|
<0.0001 |
|
(0.013) |
(0.11) |
|
|
| Sn |
0.035 |
0.0004 |
<0.002 |
|
0.049 |
0.0001 |
0.002 |
0.0003 |
| As |
|
|
0.002 |
0.0002 |
0.052 |
0.0005 |
0.003 |
0.0005 |
| Zr |
|
|
<0.0001 |
|
0.01 |
0.0004 |
0.13 |
0.0007 |
| Ca |
|
|
<0.001 |
|
0.0013 |
0 |
|
|
| B |
0.0033 |
0.00014 |
<0.0004 |
|
0.003 |
0.00006 |
|
|
| Sb |
|
|
|
|
0.019 |
0.0002 |
|
|
| N |
|
|
0.0027 |
0.0002 |
|
|
|
|
| Ta |
|
|
|
|
|
|
|
0.11 |
Measurement Conditions
All samples, including carbon, were determined for a period of 198 seconds, as shown in Table 3.
Table 3. Calibration results and measurement times
| Element |
Measurement time at peak position (s) |
RMS (wt%) |
K-factor |
| C fixed |
30 |
0.0397 |
0.0587 |
| C gonio |
30 |
0.0326 |
0.0463 |
| Al |
8 |
0.0068 |
0.0178 |
| Si |
8 |
0.0153 |
0.0208 |
| P |
6 |
0.0015 |
0.0042 |
| S |
6 |
0.0031 |
0.0085 |
| Ti |
6 |
0.0059 |
0.0132 |
| V |
4 |
0.0051 |
0.0088 |
| Cr |
4 |
0.0175 |
0.0127 |
| Mn |
4 |
0.0096 |
0.0105 |
| Co |
6 |
0.0018 |
0.0042 |
| Ni |
8 |
0.0094 |
0.0098 |
| Cu |
8 |
0.0074 |
0.0118 |
| As |
10 |
0.0025 |
0.0061 |
| Zr |
4 |
0.0047 |
0.0099 |
| Nb |
6 |
0.0040 |
0.0083 |
| Mo |
4 |
0.0062 |
0.0086 |
| Sn |
12 |
0.0028 |
0.0069 |
| Sb |
20 |
0.0012 |
0.0033 |
| Ta |
8 |
0.0076 |
0.0161 |
| W |
12 |
0.0069 |
0.0136 |
| Pb |
20 |
0.0013 |
0.0040 |
The goniometer was used to examine the carbon content, when a dedicated fixed channel was used the measurement time was reduced by 30 seconds. In this study measurements were taken at peak positions for all 21 elements, ensuring excellent precision even at low concentration levels.
The application also prevents the need for background measurements. Following this, measurement times were optimized across the entire calibration range of concentrations and elements. In the case of important elements the following formula was used to estimate the optimized measurement times:
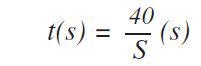
Where S stands for the sensitivity (kcps/wt%) based on the principle that at the concentration level of 100% about 4 x 10⁶ counts are needed to acquire a relative counting statistical error (CSE) of 0.05%. This statistical error is a standard measure in metal analysis. For the lower end of the calibration range, the following formula was used to optimize the measurement times:
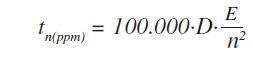
Where, tn(ppm) is the time required to identify a specific concentration of element n in ppm, and E is reciprocal of S.
LAS Master Calibration
The precision of the master calibration can be seen in the calibration plots (Figures 1 to 8) and Table 3.
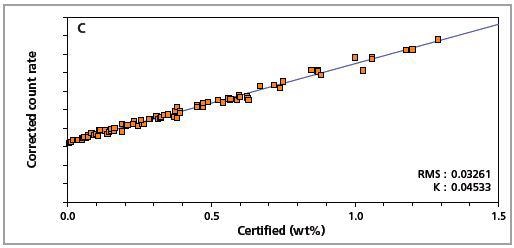
Figure 1. Low alloy steel calibration graph for carbon (C) analyzed on a goniometer channel.
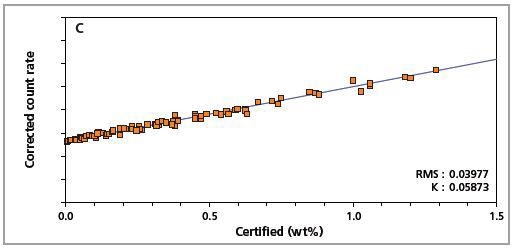
Figure 2. Low alloy steel calibration graph for carbon (C) analyzed on a fixed channel.
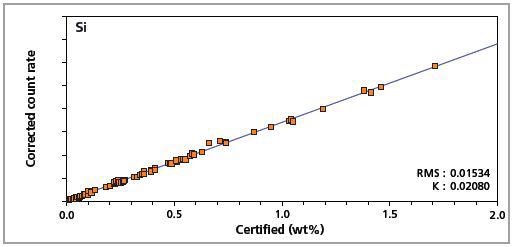
Figure 3. Low alloy steel master calibration graph for silicon (Si).
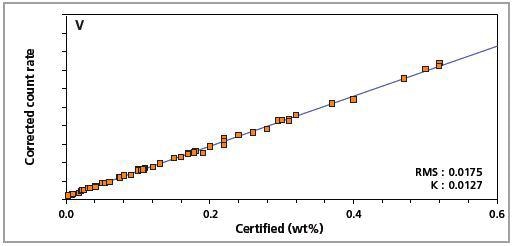
Figure 4. Low alloy steel master calibration graph for vanadium (V).
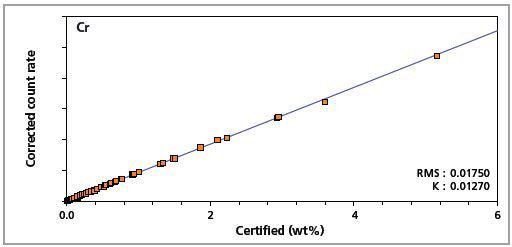
Figure 5. Low alloy steel master calibration graph for chromium (Cr)
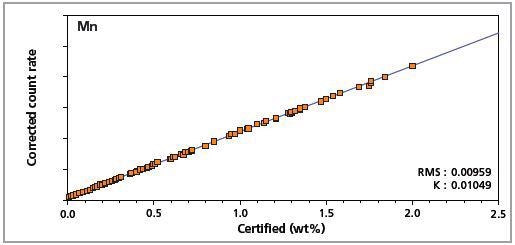
Figure 6. Low alloy steel master calibration graph for manganese (Mn).
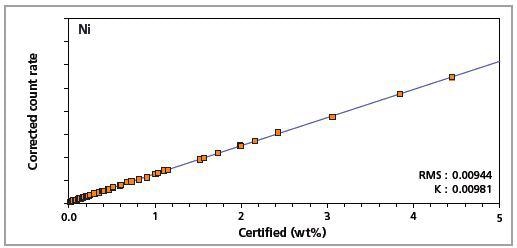
Figure 7. Low alloy steel master calibration graph for nickel (Ni)
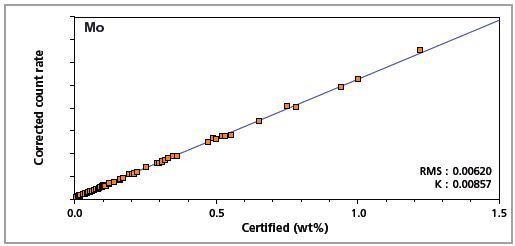
Figure 8. Low alloy steel master calibration graph for molybdenum (Mo)
The K-factor and the root mean square (RMS) values indicate the quality of calibration and demonstrate the extent of variation between the quantified and certified concentrations. More precise calibrations are indicated by lower values for the K-factor and RMS. Generally, K-factors spanning between 0.01 and 0.05 suggest precise calibrations.
The Panalytical FP model was applied in the calibration to measure the matrix correction term (M) using the following calibration formula:

Where, C = concentration (wt%), D = intercept (wt%), E = slope (1/(kcps/wt%)), and R = measured intensity (kcps)
The SuperQ software uses the FP algorithm to measure matrix corrections from the hypothetical laws, which control the law of X-rays. As a result, FP models are better than theoretical alphas and other coefficient-based matrix corrections.
The former model measures matrix corrections that are specific for individual samples. This ensures precise analysis across a broad concentration range and for different sample types. Precise analysis can also be realized beyond the concentration range bracketed by the standards.
Detection Limits
Table 4 shows the lower detection limit for individual element.
Table 4. Lower limits of detection (LLD) for a 2.4kW application
| Element |
LLD at measurement time (ppm) |
LLD (100 s) ppm |
| C fixed |
171.3 |
93.8 |
| |
|
|
| C |
149.5 |
81.9 |
| Al |
8.3 |
2.3 |
| Si |
6.6 |
1.8 |
| P |
1.3 |
0.3 |
| 8 |
1.3 |
0.3 |
| Ti |
6.3 |
1.5 |
| V |
5.6 |
1.1 |
| Cr |
5.7 |
1.1 |
| Mn |
8.5 |
1.7 |
| Co |
15.2 |
3.7 |
| Ni |
12.7 |
3.6 |
| Cu |
11.9 |
3.4 |
| As |
2.9 |
0.9 |
| Zr |
2.6 |
0.5 |
| Nb |
2 |
0.5 |
| Mo |
2.8 |
0.6 |
| Sn |
7.3 |
2.5 |
| Sb |
6.4 |
2.9 |
| Ta |
26 |
7.4 |
| W |
23.4 |
8.1 |
| Pb |
4.6 |
2.1 |
The values are measured using the following formula:
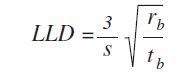
Where, S =sensitivity (cps/ppm), rb =background count rate (cps), and tb =counting time background (s)
Accuracy
Six certified reference materials were determined as standard samples to verify the LAS calibration as well as to demonstrate the precision of the Zetium systems for investigations of minor, major and trace elements present in LAS.
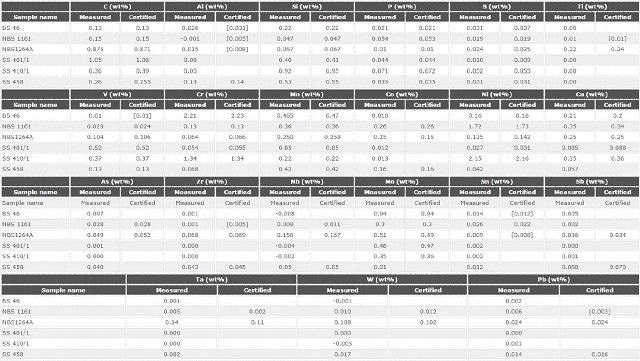
Table 5 shows the results which demonstrate good agreement of the quantified values with the certified values, including light elements. This shows the excellent performance of the LAS calibration.
Table 5. Analytical accuracy: comparison between certified and measured values for 21 elements in 6 certified reference materials against the master calibration
Precision and Instrument Stability
The certified reference material was measured against the LAS master calibration to determine the precision of the Zetium spectrometer as well as the LAS calibration. Before each measurement, the surface of the SS 401/1 standard was re-polished and examined 10 times for a brief accuracy test.
This was done to demonstrate the excellent accuracy of the C analysis. To demonstrate the instrument stability, the same standard was measured for 10 days without re-polishing its surface.
Results were acquired without any drift correction. Upon comparing the RMS value against the CSE given in concentration units, both the method precision and excellent stability of the Zetium system can be observed (Table 6).
Table 6. Analytical precision derived from repeated measurements of a low alloy steel CRM (SS 401/1)
| |
C |
Al |
Si |
P |
S |
V |
Cr |
Mn |
Co |
Ni |
Cu |
Mo |
| (wt%) |
(wt%) |
(wt%) |
(wt%) |
(wt%) |
(wt%) |
(wt%) |
(wt%) |
(wt%) |
(wt%) |
(wt%) |
(wt%) |
| Short-term (10 consecutive measurements with grinding) |
| Mean (wt%) |
1.058 |
0.078 |
0.405 |
0.045 |
0.010 |
0.528 |
0.053 |
0.852 |
0.012 |
0.028 |
0.085 |
0.475 |
| Min. (wt%) |
1.026 |
0.076 |
0.400 |
0.044 |
0.010 |
0.519 |
0.053 |
0.844 |
0.011 |
0.027 |
0.083 |
0.473 |
| Max. (wt%) |
1.086 |
0.080 |
0.410 |
0.046 |
0.010 |
0.538 |
0.054 |
0.857 |
0.013 |
0.030 |
0.087 |
0.476 |
| RMS (wt%) |
0.0197 |
0.0015 |
0.0036 |
0.0006 |
0.0003 |
0.006 |
0.0006 |
0.0033 |
0.0006 |
0.0009 |
0.001 |
0.0012 |
| RMS rel. (%) |
1.864 |
1.97 |
0.887 |
1.368 |
2.855 |
1.127 |
1.069 |
0.392 |
5.033 |
3.37 |
1.153 |
0.249 |
| Counting statistical error |
| CSE mean (wt%) |
0.0114 |
0.0012 |
0.0024 |
0.005 |
0.0003 |
0.0016 |
0.0006 |
0.0019 |
0.0008 |
0.0008 |
0.0009 |
0.0009 |
| Long-term (over 10 days, no grinding) |
| Mean Conc. |
1.093 |
0.077 |
0.405 |
0.045 |
0.010 |
0.528 |
0.053 |
0.851 |
0.013 |
0.028 |
0.090 |
0.475 |
| Min. Conc. |
1.067 |
0.075 |
0.403 |
0.044 |
0.010 |
0.524 |
0.052 |
0.847 |
0.011 |
0.027 |
0.088 |
0.474 |
| Max. Conc. |
1.126 |
0.080 |
0.407 |
0.046 |
0.011 |
0.530 |
0.054 |
0.857 |
0.015 |
0.028 |
0.091 |
0.477 |
| RMS Conc. |
0.0197 |
0.0015 |
0.0021 |
0.0005 |
0.0003 |
0.0016 |
0.0006 |
0.0028 |
0.0012 |
0.0005 |
0.0007 |
0.0007 |
| RMS rel. Conc. (%) |
1.800 |
1.937 |
0.511 |
1.075 |
3.353 |
0.301 |
1.110 |
0.327 |
8.999 |
1.934 |
0.727 |
0.149 |
| Counting statistical error |
| CSE mean (kcps) |
0.005 |
0.009 |
0.018 |
0.015 |
0.009 |
0.086 |
0.048 |
0.116 |
0.05 |
0.015 |
0.019 |
0.143 |
| CSE rel. (%) |
0.638 |
1.325 |
0.567 |
1.097 |
1.953 |
0.291 |
0.519 |
0.216 |
0.331 |
0.862 |
0.649 |
0.175 |
The CSE is the least possible error. The identical magnitude of the CSE and RMS values indicates that the errors arising from the Zetium instrument are insignificant. Figures 9 and 10 show the short-term and long-term repeatability results for Al, C and Si in CRM SS 401/1, respectively.
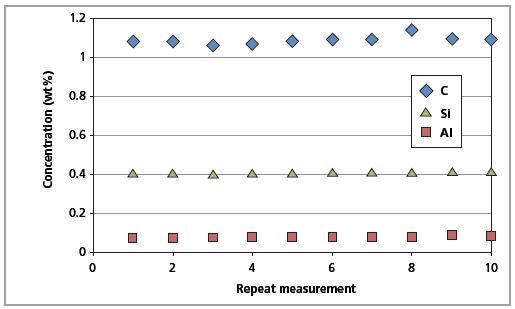
Figure 9. Short-term repeatability results for C, Al and Si in CRM SS 401/1 (10 repeated measurements).
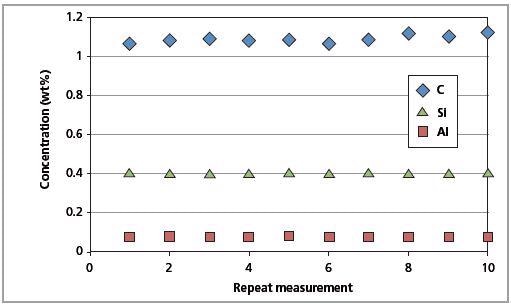
Figure 10. Long-term repeatability test results for C, Al and Si in CRM SS 401/1 (10 days).
Conclusion
The metal industry often uses XRF elemental analysis for process and quality control measures. The Zetium spectrometer integrated with the pre-calibrated LAS application module provides a suitable solution for studying minor, major and trace elements in LAS.
The above results demonstrate that the Zetium system not only provides fast and accurate analysis, but also offers the preferred stability required in challenging conditions. Whilst the instrument has been designed to address the key requirements of the metal industry it can be scaled up to improve its speed and accuracy.
Some of the improved features include direct loading and continuous loading for additional speed of analysis, better power and a sealed Xe counter to ensure lower limits of detection. The integration of the Zetium spectrometer to laboratory automation setups is much easier, enabling high throughput through coupling to sample preparation systems, X-ray diffractometers and OES spectrometers.

This information has been sourced, reviewed and adapted from materials provided by Malvern Panalytical.
For more information on this source, please visit Malvern Panalytical.