The European Union put forward the REACH regulations in June 2007 for the registration, evaluation, authorization and restriction of chemicals. The aim of this resolution was to raise the levels of protection of human health and the environment from harmful chemicals and to delegate the responsibility of understanding and managing the associated risks to chemical importers and manufacturers.
According to the REACH regulations, importers and manufacturers need to register substances with the European Chemicals Agency (ECHA). The registration process involves a detailed set of analytical data for the verifcation of a materials identity.
Tests such as FTIR, NMR, UV-VIS and mass spectroscopy to determine molecular structures and LC or GC tests for assessing impurities are the basic requirements of the ECHA. Some special cases may require additional processes like X-ray fluorescence or X-ray diffraction.
Although it seems like a simple procedure to characterize solids and liquids as per the ECHA norms, the characterization of gases tends to be problematic as most of these techniques are not useful for the majority of gases. Techniques like mass spectroscopy, GC and FTIR are suitable for certain gases, but techniques like NMR spectroscopy are not. Substantial information can be obtained by UV-VIS spectroscopy only in the case of gases that contain strong chromophores.
The concern about rejection of applications by the ECHA based on just these three analytical techniques is increasing, which in turn triggers the need for alternative approaches towards characterization of gases.
One of the potential alternative techniques is Raman spectroscopy since it enables the identification of homonuclear diatomics that are inactive to infrared radiation. Raman spectroscopy also provides information similar to, but complementary to, FTIR spectroscopy which is an accepted technique for REACH registration.
Raman Measurement of Gases
Due to the low number density of molecules in samples at atmospheric pressure the Raman scattering obtained from vapors or gases is normally weak. To obtain high quality data from gases on short timescales, a new probe design like the Kaiser AirHead™ may be used.
In this experiment, the AirHead probe is linked to a Kaiser RamanRxn Systems™ analyzer that is fitted with a 100 mW 532 nm diode-pumped Nd:YAG laser and a Peltier-cooled CCD detector. The sample-handling system for this experiment is presented in Figure 1. Analysis using Raman spectroscopy was conducted on-site with the cell in the gas handling line.
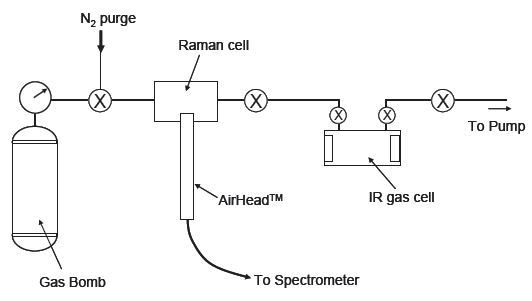
Figure 1. Schematic diagram of gas-handling system.
Example CH4/H2 Mixture
The spectrum obtained from a methane sample containing around 1% hydrogen is shown in Figure 2. It can be seen from the spectrum that strong, sharp rovibrational band patterns between the 3000 and 1500 cm-1 region are a typical fingerprint for methane gas.
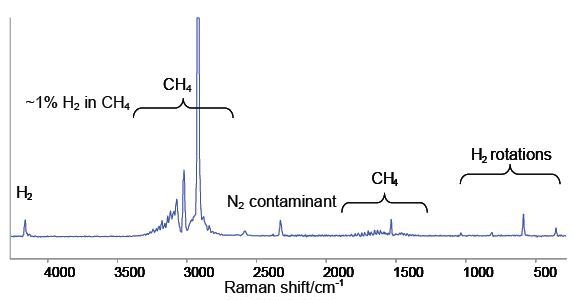
Figure 2. Raman spectrum of 1% H2 in CH4. The sharp bands below 1040cm-1 are the pure rotational transitions of the H2 molecule.
The H2 stretching vibration is represented by the single band near 4159 cm-1. Due to the absence of a H2 dipole moment during vibration this mode is not active in the infrared spectrum. In this scenario even though FTIR spectroscopy, which is the default technique requested by ECHA for vibrational spectroscopy, is able to detect methane the data provided for material composition is misleading because it does not account for the hydrogen component.
The H2 stretching band appears as a series of distinct bands between 1040 cm-1 and 350 cm-1, representing pure rotational transitions of the H2 molecule. Other species exhibit such transitions at lower wave numbers because the moment of inertia of H2 is comparatively lower. Detection of H2 at such low concentrations (1%) in CH4 becomes difficult. Raman spectroscopy is capable of overcoming the limitations of current analytical techniques by enabling gas-phase-capable techniques for the quantitative measurement of homonuclear diatomics.
Example: Isobutylene and Butadiene
The Raman spectra of two samples of unsaturated C4 gases obtained by the averaging of six scans of 30 second duration is shown in Figure 3.
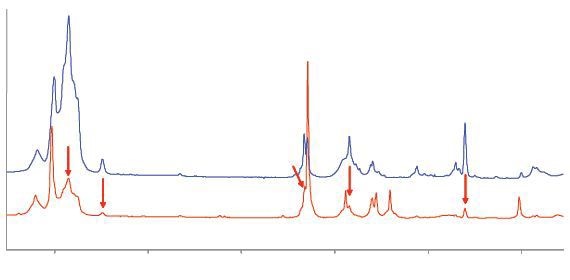
Figure 3. Raman spectra of C4 gases. The upper trace is consistent with isobutylene; the lower trace has strong bands due to butadiene and several weaker bands (arrowed) due to isobutylene.
The upper blue trace in the spectrum emitted by the first sample corresponds to isobutylene. The second sample emits the lower trace corresponding to butadiene. In addition to the two main traces, there are numerous weak bands which are marked as vertical rows confirming the low concentration of isobutylene.
Other Gases
Figure 4 shows the spectra of three other hydrocarbon samples, which demonstrates the suitability of the AirHead probe for the general analysis of simple gases. The three spectra represent the average of the six scans that lasted 30 seconds. The traces in the upper and middle region correspond to propane and n-butane respectively, whilst the lower trace is for propene with a small propane impurity.
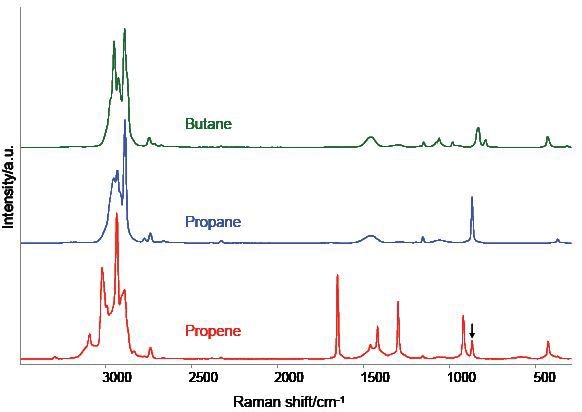
Figure 4. AirHead™ spectra of three common hydrocarbon gases. A weak band near 870 cm-1 suggests a minor propane impurity in the propene.
Conclusion
The ability of gases to instantly yield high-quality Raman spectra is demonstrated by these examples. The distinct finger print provided by the Raman spectrum is useful to validate molecular structures and in the quantitative analysis of mixtures. Comprehensive characterization of a sample can be carried out by combining IR and Raman spectroscopy, since both of them are subject to different selection criteria.
Using either of these two techniques by themselves could provide misleading results of the molecular composition. The ability of Raman spectroscopic methods in detection and quantitation of homonuclear diatomics, which cannot be accessed by IR techniques, is demonstrated in this article. In addition to this, the effectiveness of Raman spectroscopy in satisfying REACH registration of solids and liquids is also demonstrated.

This information has been sourced, reviewed and adapted from materials provided by Kaiser Optical Systems, Inc..
For more information on this source, please visit Kaiser Optical Systems, Inc..