Polymers with favorable physical properties can be created by altering their properties by derivatisation or changing their structure. For example, the bromination of polystyrene gives fire resistant properties to polystyrene allowing it to be used in consumer goods like furniture. In addition to the challenges faced when creating derivatised polymers the characterization of derivitised polymers is also difficult.
The Mark-Houwink Plot
Traditional methods like gel permeation chromatography (GPC) use a single detector to compare polymer samples, and as a result they are not capable of providing comprehensive comparison results. Comprehensive characterization of different types of polymers is possible using measurement methods that use multiple detectors. One of the results obtained from in advanced multi-detector GPC technique is the Mark-Houwink plot. This plot is a robust tool that can be used to examine polymer structures in solution.
The relation between polymer structure and molecular weight can be clearly established with high sensitivity based on the Mark-Houwink plot. The molecular weight (MW) is plotted against the intrinsic viscosity (IV) on a log-log graph to obtain this plot. The length of the polymer chains, i.e. the degree of polymerization, is indicated by the molecular weight, however this alone is not enough to understand the structure. The molecular density of the polymer chains in solution can be derived from the value of intrinsic viscosity (dL/g).
Polymer chains that fold tightly or coil in solution exhibit a higher density and lower intrinsic viscosity. Measurements of intrinsic viscosity do not depend on the molecular weight; and hence, it is possible for two different structures with the same molecular weight to have different intrinsic viscosities. For instance, a branched polymer and a linear (unbranched) polymer exhibit different intrinsic velocities even though they have the same molecular weight.
Structural changes in a polymer across its molecular weight distribution result changes in it's intrinsic viscosity that can be detected easily, which is why the Mark-Houwink plot is extremely useful and significant. The Mark-Houwink plot derives the raw data from advanced multi-detection GPC/SEC techniques by combining the value of molecular weight obtained from a light scattering detector with the value of intrinsic intensity from the viscometer detector.
Measurements for both data sets are recorded at each point throughout the elution profile of the sample. A variety of assessments can be made based on the plot, from simple assessment of the proximity of the two structures to complex quantitative evaluation of polymer branching.
This article demonstrates how the Mark-Houwink plot can be used to differentiate the structural differences caused by polymer branching from that brought about by changes in composition (bromination) using polystyrene.
Polymer Properties
There is a strong dependence of the physical properties of polymers on the properties of the individual polymer molecules. The behavior of the polymer is influenced by its molecular weight, the distribution of molecular weight, and the intrinsic viscosity, molecular size and structure. Gel-permeation chromatography (GPC) and Size-exclusion chromatography (SEC) are typically used for determining these properties of synthetic polymers.
Advanced GPC/SEC
In the GPC technique, the sample is made to travel via a porous but inert chromatography matrix for the separation of smaller molecules which can penetrate deeply from the larger molecules, which are excluded. The large, excluded molecules travel through the column faster. The separation is on the basis of a polymer's hydrodynamic volume and the obtained data is a concentration profile of the sample separated based on size. A multi-detector GPC/SEC system that simultaneously detects based on light scattering, refractive index (RI), intrinsic viscosity (IV) and ultraviolet (UV) is used for obtaining a vast amount of information about the sample.
Materials and Methods
Two Viscotek T6000M columns were used for separating the sample. THF was used as the mobile phase which was stabilized with 300 ppm BHT. In order to ensure complete dissolution, the samples were left to dissolve overnight. Generation of the data was achieved using the new Malvern Panalytical OMNISEC system (Figure 1) with the following set up:
- Flow rate is 1.0 mL/min
- Autosampler temperature is 15°C
- Detectors temperature is 35°C
- Column oven temperature is 35°C
The OMNISEC software version 10 was used to control the system, acquisition, analysis and reporting of data. All of the =samples that were analyzed were polystyrenes: the first was linear, the second was star-branched polystyrene and the third was brominated linear polystyrene.
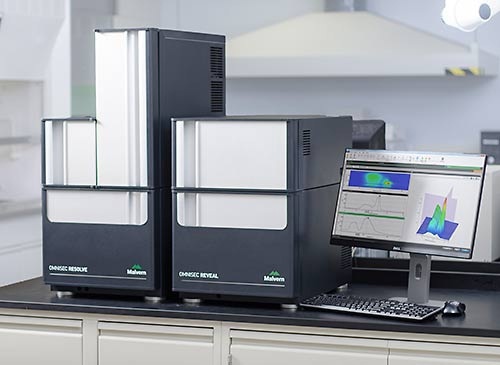
Figure 1. The OMNISEC system, comprising OMNISEC RESOLVE (left) and OMNISEC REVEAL (right).
Results
Chromatography was successfully and easily performed on all three polymers, the corresponding triple detection chromatogram for all the three samples is depicted in Figure 2. It can be seen from the figure that each of the samples show the right angle light scattering (RALS), viscometer signals and the low angle light scattering (LALS).
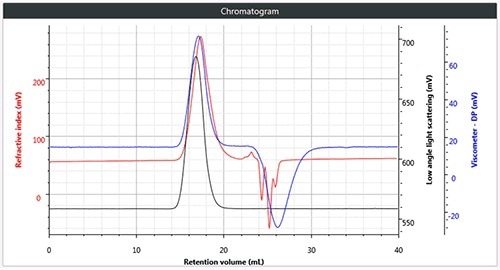
Figure 2. a). Triple chromatogram of linear (unbranched) polystyrene.
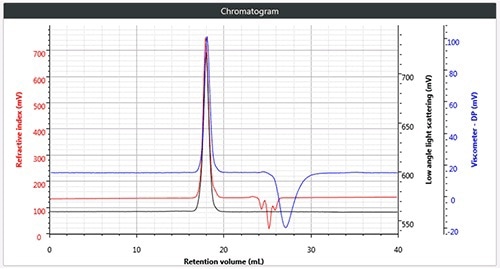
Figure 2. b). Triple chromatogram of star branched polystyrene.
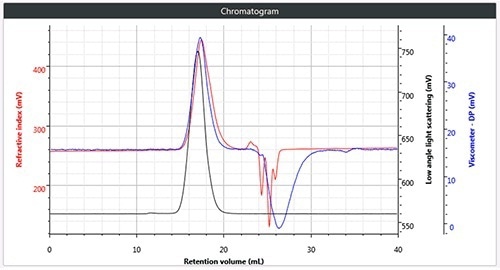
Figure 2. c). Triple chromatogram of brominated polystyrene.
The UV-vis photo-diode array (UV-PDA) detector in the OMNISEC system was also used along with the above detectors for collecting high quality spectral data at every point, for facilitating identification and differentiation of the sample. The numerical results obtained for duplicate injections for the three samples are presented in Table 1. The results revealed that the molecular weight to intrinsic viscosity ratio of the branched samples is different from that of the brominated samples.
Table 1. Numerical results obtained for duplicate injections for the three samples.
| Parameter |
Polystyrene samples |
| Linear |
Star branched |
Linear brominated |
| Retention volume (mL) |
17.360 |
17.943 |
17.447 |
| Mn (Da) |
108,810 |
114,650 |
262,240 |
| Mw (Da) |
237,090 |
123,120 |
541,850 |
| Mz (Da) |
371,520 |
133,050 |
970,640 |
| PD (Mw/Mn) |
2.179 |
1.074 |
2.066 |
| Intrinsic viscosity (dL/g) |
0.832 |
0.451 |
0.282 |
| Rhw (nm) |
13.904 |
9.528 |
12.688 |
The Mark-Houwink plot clearly shows the differences (Figure 3).
From the plot, it can be observed that the highest viscosity, which is due to the most open structure and low density, is shown by linear polystyrene shaded in red. Just below the liner polystyrene is the star-branched polystyrene, shaded in purple, because of the increased density in solution due to branching. The lowest spot in the plot is occupied by brominated polystyrene, shown in green because it exhibits the lowest intrinsic viscosity due to a lower molecular weight than unbrominated samples.
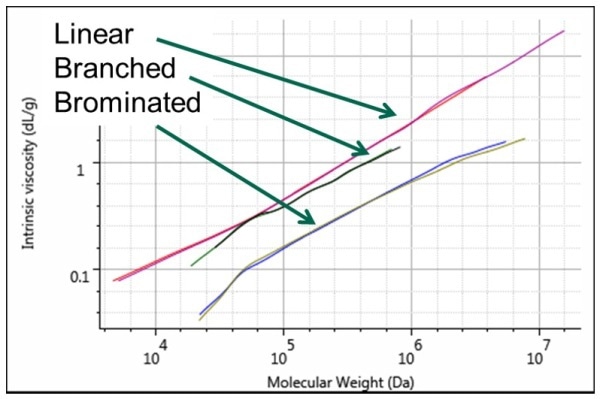
Figure 3. Mark-Houwink plot showing the structural differences between the 3 polystyrene samples. Linear in red and purple, star-branched in black and green, brominated in blue and olive.
Due to bromination, the hydrogen atoms of atomic mass of 1.0 in styrene are substituted by the heavier bromine atoms of atomic mass of 79.9, which results in a higher MW without an increase in the molecular chain length when compared with unbrominated polystyrenes. An increase in mass with the same chain length increases the molecular density in solution, which, in turn as a result decreases the intrinsic viscosity.
Now, the question of being able to differentiate the effect of substitution and structural change between brominated and star-branched polystyrene arises both of which show lower intrinsic viscosity. This differentiation can be easily made with the help of the spectral data obtained from UV-PDA (Figure 4). The UV spectra obtained from the peaks of the three samples is depicted in the figure.
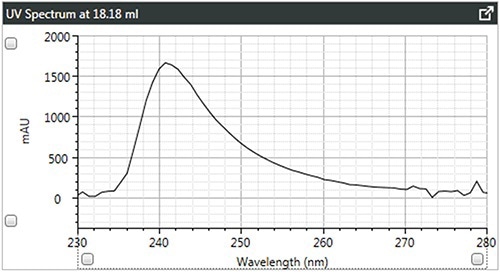
Figure 4. a). UV spectra of brominated polystyrene.
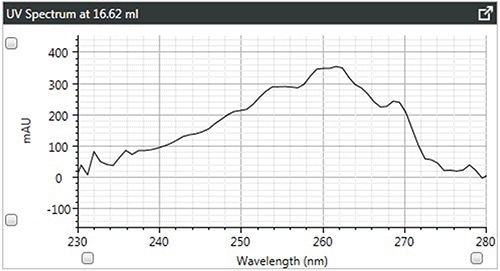
Figure 4. b). UV spectra of linear polystyrene.
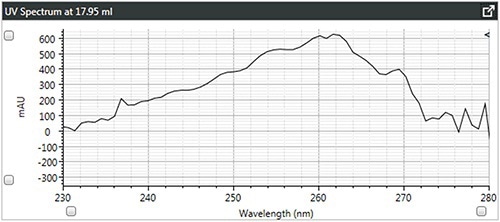
Figure 4. c). UV spectra of star-branched polystyrene.
It can be observed that the linear and branched polystyrenes exhibit relatively similar spectra, which confirms that any differences in their Mark-Houwink plots are caused due to changes in structure due to branching. The spectrum of brominated polystyrene however, as expected, shows a shift in the λ-max from 262 to 241 nm, which indicates a difference in composition.
Conclusion
Using the OMNISEC system, highly sensitive and top quality data was obtained using multi-detection GPC/SEC methods, which is extremely useful when examining the effects of compositional and structural changes in polymers based on the Mark-Houwink plot. It is also evident from the above experiments that the Mark-Houwink plot and the data obtained from UV spectra can be used to evaluate structural changes like branching independent of MW and also for establishing the difference between these changes and changes due to compositional or substitution changes.
Manufacturers and scientists are able to fully comprehend, estimate and control the end properties of polymer samples based on the understanding of the chemical or structural changes in polymers during production gained from GPC data and Mark-Houwink plot. This understanding eventually leads to a higher quality of polymer research and products.

This information has been sourced, reviewed and adapted from materials provided by Malvern Panalytical.
For more information on this source, please visit Malvern Panalytical.