With the advent of new environmental regulations, many chemical manufacturers and oil refineries implemented techniques to determine the composition of waste gas streams that are typically headed to the flare. In November 2015, the US EPA implemented 40 CFR 60 subpart Ja, which required the analysis of Total Sulfur and hydrogen sulfide in refinery flare gas, with comparable needs being implemented in global markets. Since then, the regulation was increased by the EPA to comprise the reporting of the BTU content.
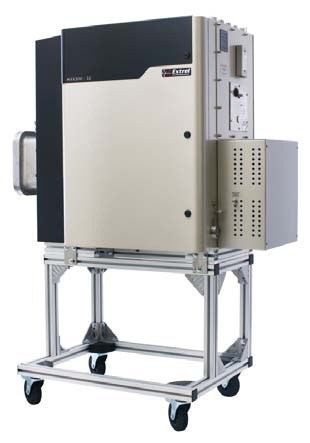
Figure 1. The MAX300-AIR is an environmental mass spectrometer capable of performing quantitative analysis on a wide variety of compounds at concentrations ranging from 10 ppt* to 100%. The system is optimized for fully- automated, continuous analysis in hazardous industrial settings.
Flare streams include a combination of waste gas from numerous plant processes, and their composition can alter considerably and rapidly. The samples’ dynamic nature combined with the possibility for a high-level discharge of hydrocarbons and sulfurs makes real-time mass spectrometry suitable for flare monitoring. The industrial mass spectrometer MAX300-AIR is a single-analyzer solution suitable for the whole flare CEMS application (Figure 1). It is capable of determining the complete speciated composition of the flare gas stream and delivering automated and incessant BTU, Total Sulfur, and H2S data.
The MAX300-AIR mass spectrometer is linear across the whole detection range for all components. As a result, EPA approved the validation techniques utilizing ppm-level H2S bottles at locations that traditionally have high concentrations of sulfur in their flare gas streams. Moreover, percent-level sulfur standards can be hazardous to plant workers and are also costly to maintain. In comparison to the alternative method, gases validated by the MAX300-AIR spectrometer are considered to be safe and economical.
Fully Speciated Flare Composition and Root Cause Analysis
NSPS Ja was implemented in November 2015, and since then the MAX300-AIR instrument has been used to determine complete composition flare information throughout U.S. refineries. Refineries have to report about the root cause analysis (RCA) when the levels of H2S surpass 162 ppmv, in addition to the H2S, BTU, and Total Sulfur values. Customers who use the MAX300-AIR spectrometer have the required data to detect which process units play a major role in the flare stream at a specified time. Speciated gas analysis in real time helps to ensure that RCA and the subsequent corrective action planning are quick and precise. The MAX300 investigation of a high sulfur event in a refinery flare stream is shown in Figures 2, 3 and 4.
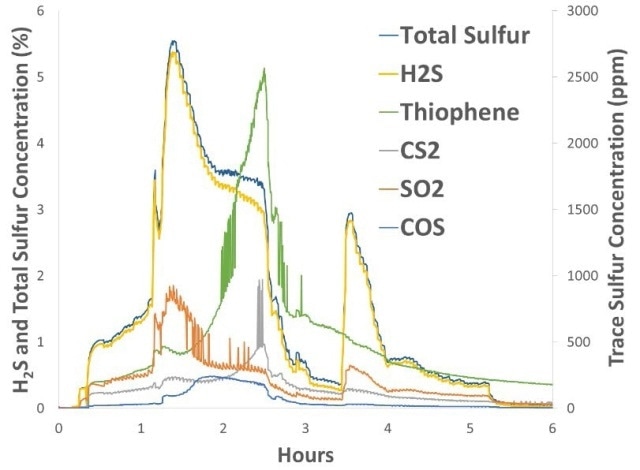
Figure 2. Total Sulfur is shown with the top 5 sulfur compounds measured during the flare event. Total Sulfur is calculated from the sum of the speciated sulfur analysis. Hydrogen sulfide was the most prevalent, reaching 5.4%, but several other sulfurs were present at ppm levels, at times contributing significantly to the Total Sulfur number.
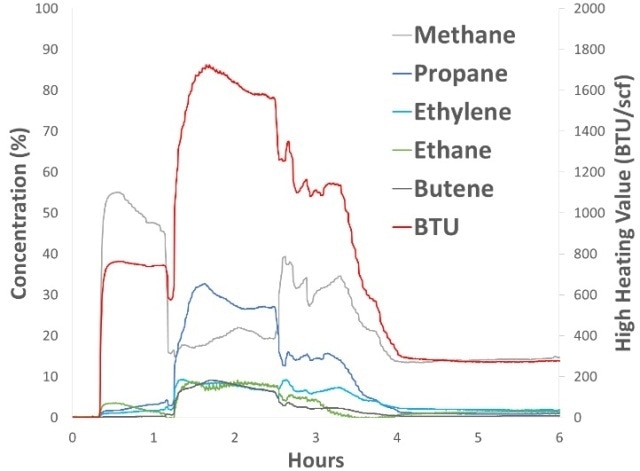
Figure 3. Flare stream BTU and the top 5 contributing hydrocarbons. Increases in propane and other C3+ compounds drove the high heating value to over 1720 BTU/scf at the same time that the sulfur compounds reached their highest levels.
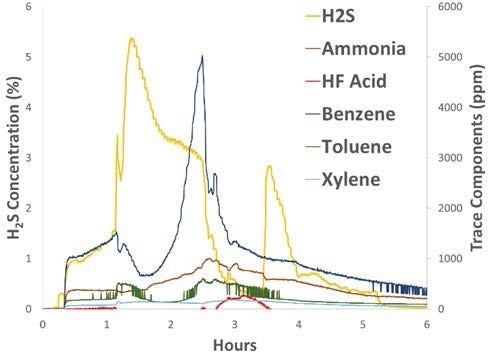
Figure 4. Trace components are shown along with the H2S trend indicating the progression of the flaring event. In addition to the compounds above, the MAX300 was measuring hydrogen, nitrogen, oxygen, carbon dioxide and water.
At this location, the MAX300 mass spectrometer was carrying out concurrent measurement of 31 components, including 14 hydrocarbons and 10 sulfur compounds. With this approach, refinery receives the data required for compliance and also provides a better understanding about the type of material being vented by the operating plants.
When the flare gas is being discharged from the probe and via the sample handling cabinet, a small part of the gas flows continuously inside the vacuum chamber of the MAX300 system. In this chamber, this gas is ionized and scanned electrically by the mass filter.
For each component, the analysis takes place at a speed of 0.4 seconds and BTU and Total Sulfur are then automatically measured and transferred to the data system of the refinery. The complete list of compounds determined by the MAX300 system is actually measured based on users’ requirements, and a number of trace contaminants are usually included in the flare gas application (Figure 4). If required, more components can be easily added going forward.
In the application of flare gas, 1 ppm to 100% is the measurement range for H2S on the MAX300 analyzer. In order to show the linearity of response across this measurement range, the MAX300 instrument was joined to a sample system where high purity CO2 and H2S standards were mixed together with the help of a dilution system. After a single-point calibration, the composition of the sample was modified and the MAX300 analyzer carried out precise linear measurements of H2S at a number of points from 0 to 100%, as shown in Figure 5.

Figure 5. Full-scale linearity of hydrogen sulfide. The dynamic range for H2S in the flare gas application is 1 ppm to 100%. The sensitivity and linearity of the MAX300 is constant across that entire range based on a single-point calibration. Daily validations using <300 ppm are safe for refinery personnel and EPA approved.
Other sulfur compounds like SO2, CS2, COS and mercaptans are also present in flare gas streams, in addition to H2S. The sum of the concentration of all sulfur-based compounds is used by the MAX300 analyzer to measure and report the value of Total Sulfur to the control system of the refinery. At many locations, there is always a possibility of flare high percent-level Total Sulfur during a discharge. For the correct reporting, an analyzer that can precisely determine Total Sulfur across the predicted dynamic range is very important.
The MAX300 instrument was used to determine a number of gas standards that replicate probable flare conditions. Methyl mercaptan, H2S, COS, CS2, and SO2 contained in the bottles were gravimetrically mixed together before being verified with the GCMS technique. Through a single-point calibration, the MAX300 analyzer showed high repeatability and precision across all of the five standards (Figure 6).
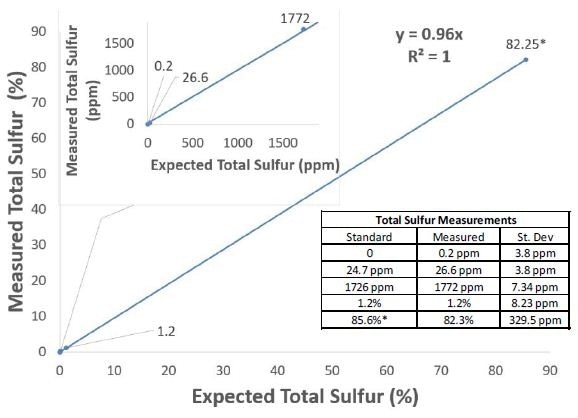
Figure 6. The Total Sulfur measurement as recorded on the MAX300-AIR. This data was gathered following a single-point calibration on a standard containing ~2000 ppm of H2S, COS, SO2, CS2 and methyl mercaptan. The system records a speciated analysis of the individual sulfur components in the mixture and calculates Total Sulfur in real-time for reporting purposes. For all components, the analyzer’s dynamic range is linear from <1 ppm to 100%.
The linearity of the mass spectrometer guarantees that a single-point calibration will be able to provide precise results on ppm sulfur readings as well as spikes up to 100%. This also means that a ppm-level H2S standard can be used to validate the performance of the MAX300 analyzer, irrespective of the highest predicted sulfur value of the refinery.
Due to the method’s proven linearity, EPA approval was given to MAX300 users to utilize bottles with less than 300 ppm H2S for day-to-day substantiations. As a result, these sites do not have to buy or manage hazardous and costly percent-level sulfur standards, leading to an improved level of safety and reduced cost for flare compliance.
High Precision Real-Time BTU Calculation
The inclusion of the BTU requirement to the flare gas application has made it possible to track hydrocarbon and other components - such as water, nitrogen, ammonia, BTX, oxygen, etc. - that are important to ensure precise reporting. The MAX300-AIR is flexible enough to enable site-specific customization of the quantified gases, and the analysis is software editable in case regulatory requirements or plant operations vary over time. Thanks to the high precision of the MAX300 analyzer, high repeatability and accuracy is ensured for the reported BTU value, irrespective of the composition of the sample (Table 1).
Table 1. Speciated hydrogen and hydrocarbon measurements and calculated stream High Heating Value (HHV)
| Component |
Measured Concentration (%) |
STD (ppm) |
| Hydrogen |
16.36 |
850 |
| Methane |
78.99 |
840 |
| Nitrogen |
0.38 |
62.7 |
| Propane |
0.811 |
61.2 |
| Ethane |
0.01649 |
49.5 |
| Propylene |
0.1257 |
19.7 |
| Isobutane |
0.276 |
30.7 |
| Carbon Dioxide |
0.751 |
25.98 |
| 1-Butene |
0.097 |
19.9 |
| N-Butane |
0.437 |
37.4 |
| Heptane |
0.0179 |
3.47 |
| Pentane |
0.1478 |
19.5 |
| Hexane |
0.014 |
11.1 |
| HHV |
936.34 BTU |
0.58 BTU |
Concentrations of all of the compounds are recorded by the MAX300-AIR within the flare stream, and the analyzer measures the HHV in real-time to report to the DCS. High precision gas analysis enables for highly accurate BTU values. The following equation is an example of HHV calculation, made to show the value in BTU/Scf. One can report HHV in whatever unit that best fits the requirements of users.
HHV = ((%H2 × 324.35) + (%CH4 × 1010.25) + (%C2H4 × 1600.72)
+ (%C2H6 × 1769.79) + (%C3H6 × 2335)
+ (%C3H8 × 2518.7) + (%C4H8 × 3082.33)
+ (%IsoC4H10 × 3254.53) + (%NC4H10 × 3264)
+ (%C5H12 × 4011.61) + (%C6H14 × 4758.72)
+ (%C7H16 × 5055.99))/100
With regard to the Total Sulfur measurement, BTU is measured and reported in real-time to the data control system of the user, together with the speciated concentrations of all the compounds that were monitored. During discharge, monitoring all of the components across the whole dynamic range offers an important resource for use in the RCA needed by the regulation.
Conclusion
The MAX300-AIR mass spectrometer is a perfect tool for making concurrent measurement of BTU, H2S, and Total Sulfur content in flare gas. The system offers the speed of analysis, flexible response, and dynamic range required for regulatory compliance such as 40 CFR 60 subpart Ja, and can track many different flare streams in an automated cycle that fulfills the required reporting rate of 15 minutes.
Important data for RCA is obtained through the speciated analysis of all components, and the MAX300’s linearity ensures precision from <1 ppm to 100%, leading to EPA approval of low sulfur verifications that considerably improve safety and reduce the costs associated with flare gas compliance.

This information has been sourced, reviewed and adapted from materials provided by Process Insights - Mass Spectrometry.
For more information on this source, please visit Process Insights – Mass Spectrometers.