At-line process monitoring (ALPM) is a major application of ultra-high performance size-exclusion chromatography (UHP-SEC). ALPM of biological drugs helps to reduce the time and effort associated with process analytics.
Though standard high-performance liquid chromatography (HPLC) has good analytical capabilities, it is too slow to be of much use in ALPM. When compared to traditional HPLC, ultra-high performance liquid chromatography (UHPLC) offers better resolution along with considerably reduced analysis time. This makes it viable to measure fragment and aggregate samples at-line, in process conditions and during expedited stability tests.
This article examines how UHP-SEC-MALS, with inline dynamic light scattering (DLS), multi-angle light scattering (MALS), and UHPLC size-exclusion chromatography (UHP-SEC), serves as an effective tool for the characterization of monoclonal antibodies and degradants/impurities encountered at line, within processing and expedited stability conditions.
The UHPLC detectors, UT-rEX and µDAWN, can establish molecular size and absolute solution molecular weight of individual eluting species. Despite this, UHP-SEC-MALS experiments take just a few minutes, making this method suitable for process monitoring.
The two antibodies - monoclonal antibody 1 (mAb1) and monoclonal antibody 2 (mAb2) - used in this analysis mimic varying conditions where high-speed process monitoring with UHP-SEC-MALS could prove suitable. The mAb1 antibody represents several fractions obtained from a purification process.
The peaks’ molar mass, determined with MALS, helps to detect each species. The end results suggest that UHP-SEC-MALS could be applied in regular in-process monitoring.
The mAb2 antibody is a molecule undergoing stability testing. Several formulations with stability conditions can lead to a countless number of samples to be characterized.
The increased throughput of UHP-SEC-MALS analysis in comparison to conventional HPLC-SEC-MALS enables the characterization of fragments, aggregates, and other degradants. It was observed that based on the quantified molar masses of these species, varying fragments could be produced by condition 3 as opposed to conditions 1 and 2.
This sample emphasizes the need for MALS detection in UHP-SEC, because the two stability conditions lead to monomers with varying elution times yet similar molar masses, as established by the MALS method.
Materials and Methods
UHP-SEC was carried out by using the BEH SEC column (200 Å, 1.7 µm, 4.6 mm x 150 mm) and an autosampler and Acquity UPLC pump (Waters Corporation).
The SEC column’s effluent was allowed to pass through Waters’ inline UV/Vis detector Optilab UT-rEX dRI detector, and Wyatt µDAWN multi- angle light scattering detector equipped with internal WyattQELS dynamic light scattering detector.
Phosphate buffered saline (PBS) was employed as the mobile phase at 0.5 mL/minute flow rate. For each chromatogram, 2 - 5 µL of sample was administered with a 5 minute run time for each sample.
Wyatt’s ASTRA software was then used for data collection and analysis. Table 1 lists all the samples.
mAb1 represents numerous phases of the purification processing steps, ending with the purified sample. mAb2 was subjected to many stability testing procedures. Bovine serum albumin (BSA) was employed to show that there is no loss of data quality or resolution as a function of flow rate.
Table 1. Antibody samples
| Sample |
Description |
| mAb1 |
Purified antibody 1 |
| mAb1-C1 |
mAb 1, process condition 1 |
| mAb1-C2 |
mAb 1, process condition 2 |
| mAb2-C1 |
mAb 2, stability condition 1 |
| mAb2-C2 |
mAb 2, stability condition 2 |
| mAb2-C3 |
mAb 2, stability condition 3 |
Results and Discussion
No Loss of Resolution with Flow Rate
Comparisons were made for molar mass distribution, peak resolution, and measured mass for BSA at several flow rates. As seen in Figure 1, no substantial change was observed in peak resolution or shape when the separation was carried out at 0.5 mL/min as opposed to 0.3 L/min.
It was also observed that the quantified molar masses for the trimer, dimer, and monomer are in good agreement, with the overall eluted mass and eluted mass for individual species remaining the same at both flow rates (Table 2).
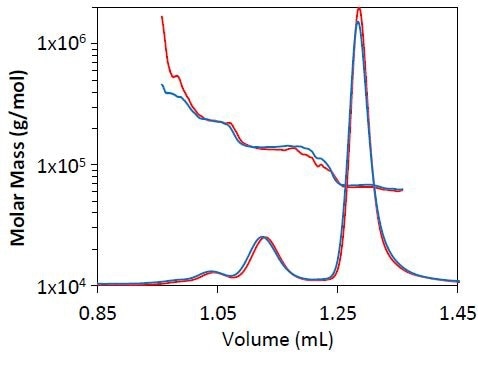
Figure 1. Light scattering chromatogram for BSA separation at 0.3mL/min (blue) and 0.5mL/min (red). The measured molar mass by MALS is overlaid for each chromatogram.
Table 2. Mass fraction of each species at the two flow rates shown in Figure 1 page 2
| |
0.3 mL/min |
0.5 mL/min |
| Monomer |
86.4% |
85.5% |
| Dimer |
8.2% |
8.1% |
| Trimer |
1.4% |
1.6% |
In-Process Monitoring of mAb1 Purification
As soon as it was determined that the molar mass accuracy and resolution did not alter as a function of flow rate, high-speed UHP-SEC-MALS was employed to measure the separate phase of mAb1 purification. About 70% of monomer is present in the starting material, mAb1- C1, with the remaining mass indicated by fragment and aggregate species.
The mAb1-C2 sample indicates an intermediate purification process, resulting in a solution of 85% monomer. The final purified antibody - mAb1 - is more than 95% monomer by mass.
The UHP-SEC-MALS method enabled fast quantitation of all mAb samples, making it suitable for ALPM. The entire species elute within three minutes, as shown in Figure 2, and the solvent peak can be seen in the RI data at an elution time of approximately 4 minutes.
This made it possible to perform a complete UHP-SECMALS experiment in as little as 5 minutes. The UHP-SEC-MALS method is both quick and reliable. The chromatograms for replicate injections of individual samples are shown in Figures 2 and 3.
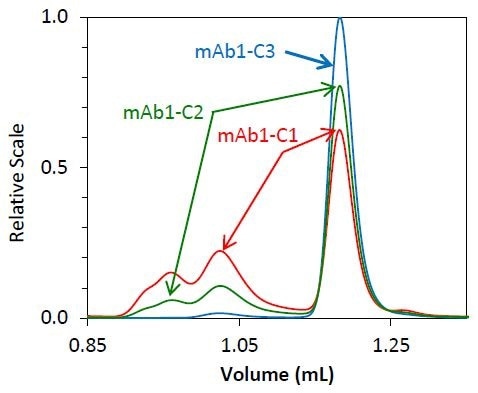
Figure 2. Overlay of light scattering chromatograms for mAb1 undergoing different stages of purification
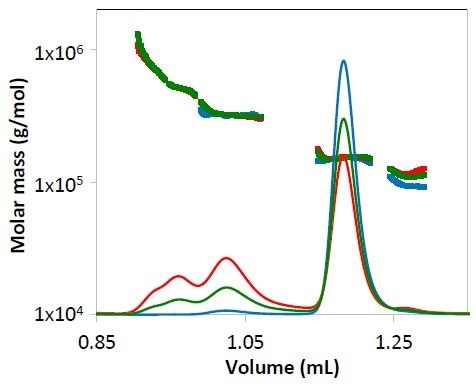
Figure 3. Concentration data from refractive index for mAb1 undergoing different stages of purification. The measured molar mass is overlaid for each peak. Chromatograms are colored as in Figure 2.
Both the light scattering data (Figure 2) and concentration quantified by refractive index (Figure 3) overlay precisely for each replicate. The identity of the eluting species can be established by molar mass.
Despite of the low concentration of specific peaks, the molar mass quantified by the µDAWN and UT-rEX detectors, was strong and consistent.
For example, in respect to the purified mAb1 (indicated by blue lines in Figures 2 and 3) and despite the fact that the highest aggregate concentration is just 0.8 µg/mL as it elutes from the column, the quantified molar mass was found to be within 2% of the molar mass determined for conditions 1 and 2, where the eluting concentration was much higher (Peak 2Mw, Figure 4).
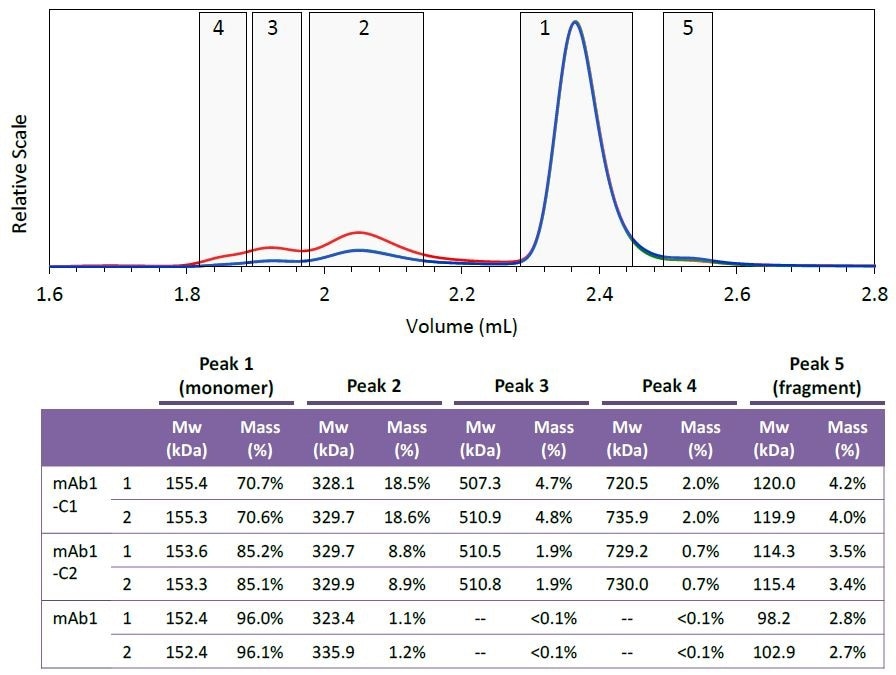
Figure 4. Peak definitions (top) and resulting molar mass and mass fraction (bottom) of each species. Two injections were performed for each mAb1 sample. Peak areas were defined at identical elution times for all six injections, as shown in the top figure (mAb1-C1). The weight-average molar mass and mass fraction for each peak are listed in the table. Plots correspond to light scattering (red), RI (blue) and UV (green) signals.
Five different species were defined based on the mAb1- C1 chromatogram. Figure 4 shows the peak definitions for these species.
The species’ mass fraction was measured by combining the RI signal for individual peaks. The table shown in Figure 4 demonstrates the effective removal of different aggregate fractions, and as the purification process progresses the monomer is enriched.
The species’ molar mass also seems to be constant for the collected fraction, as shown in Figures 3 and 4. The molar mass data provides critical information regarding the nature of individual aggregates or the purification process, such as whether new aggregate species are formed or whether the aggregates are sheared during the purification process.
Stability Testing of mAb2
In addition to purification, ALPM is preferred in accelerated stability tests that are employed to improve formulations. Stability testing can potentially create an innumerable number of samples, and it is important to measure these samples quickly and accurately.
Three stability-testing conditions were experienced by the mAb2 sample. For each condition, the mass fraction and molar mass of fragment, monomer, and dimer were measured using the same chromatography conditions as the mAb1 sample.
All three stability conditions led to different fragment, monomer, and dimer profiles. Similar chromatograms were generated by conditions 1 and 2, but mAb2-C2 included a somewhat higher fraction of dimer compared to mAb2-C1 (Figure 5 and Table 3). However, condition 3 led to a relatively small dimer yet a larger fraction of fragment, as shown in Figure 6 and Table 3.
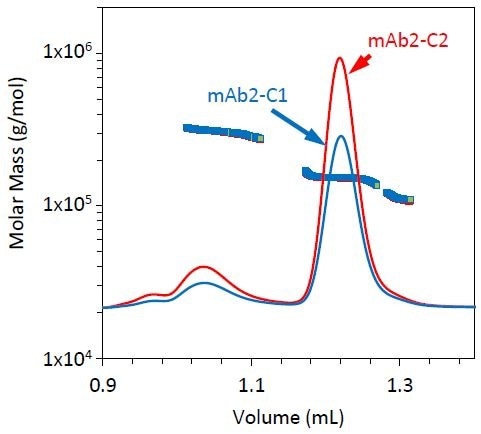
Figure 5. Refractive index chromatograms for mAb2 under stability conditions 1 (blue) and 2 (red). The molar mass of the monomer, dimer, and fragment peaks has been overlaid.
Table 3. Evolution of monomer, dimer, and fragment under different stress conditions for mAb2
| |
|
Monomer |
Dimer |
Fragment |
Mw
(kDa) |
Mass
(%) |
Mw
(kDa) |
Mass
(%) |
Mw
(kDa) |
Mass
(%) |
| mAb4-C1 |
1 |
152.8 |
87.7% |
308.4 |
8.4% |
114.4 |
4.0% |
| 2 |
152.4 |
87.5% |
305.4 |
8.7% |
111.1 |
3.8% |
| mAb4-C2 |
1 |
151.5 |
87.1% |
306.6 |
9.3% |
112.9 |
3.7% |
| 2 |
151.4 |
87.2% |
303.1 |
9.2% |
114.0 |
3.7% |
| mAb4-C3 |
1 |
153.0 |
90.2% |
286.7 |
1.2% |
132.1 |
8.6% |
| 2 |
152.7 |
90.2% |
285.1 |
1.5% |
130.2 |
8.3% |
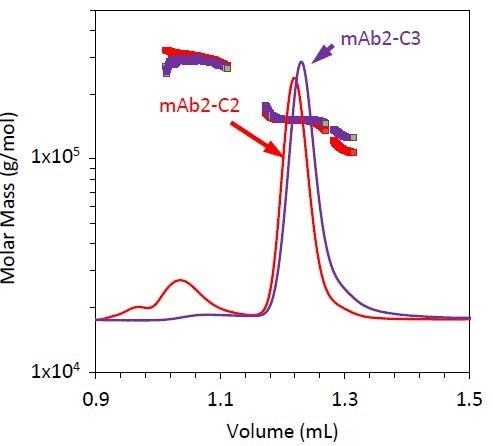
Figure 6. Refractive index chromatograms for mAb2 under stability condition 3 (purple). Molar mass values from MALS of the monomer, dimer, and fragment peaks have been overlaid. The chromatogram and measured molar mass for mAb2-C2 (red) is included for comparison.
Stability condition 3 emphasizes the requirement for MALS with SEC with two distinct variations, compared to conditions 1 and 2 (Figure 6). The monomer does not elute at the same time for condition 3 as it does for conditions 1 and 2, but the quantified molar mass of this peak remains unchanged (Table 3).
If the elution time alone is considered, then it can be concluded that the antibody has been degraded, but by measuring a similar molar mass for all three conditions, it was hypothesized that the late elution time may be the result of a conformation change such as partial unfolding or column interactions. For example, resulting from a hydrophobic patch and other residues being exposed during the course of the stability test.
The fragment’s molar mass is much higher than it is for conditions 1 and 2. This could be attributed to coelution with the monomer, or may indicate that this stability condition creates an unusual fragmentation pattern compared to conditions 1 and 2.
Besides the molar mass obtained from the MALS method, the µDAWN detector allows measuring the hydrodynamic radius through the DLS technique. The hydrodynamic radius for all three monomers is Rh = 5.1 ± 0.1 nm (Figure 7), indicating that mAb2-C3 is not considerably unfolded compared to mAb2-C2 and mAb2-C1, and the late elution time is probably the result of column interactions.
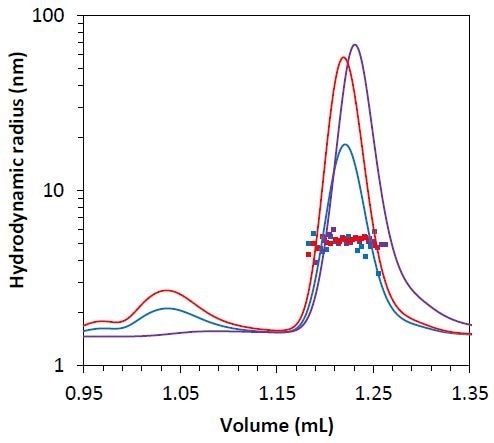
Figure 7. Measured hydrodynamic radius data for the mAb2 monomer under stability test 1 (blue), 2 (red), and 3 (purple) overlaid on light scattering chromatogram.
Conclusion
The article has described the utility of high-speed UHP-SEC in conjunction with DLS and MALS techniques for high-speed process monitoring of antibody samples. With the help of this method, measurements can be carried in just 5 minutes, allowing the observation of purification and other similar processing steps, in addition to high-throughput stability screening.
The UT-rEX and µDAWN detectors allowed critical and consistent quantification of hydrodynamic radius and the molar mass of fragments and aggregates that otherwise would not have been realized with standard analytical UHPLC alone.

This information has been sourced, reviewed and adapted from materials provided by Wyatt Technology.
For more information on this source, please visit Wyatt Technology.