Mass spectrometry is an analytical technique used for a wide range of applications. Quadrupole is the most commonly used mass analyzer.
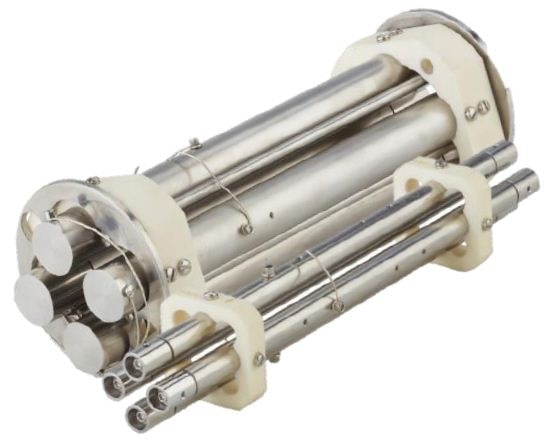
Figure 1. 19 mm quadrupole (left) versus a 9.5 mm quadrupole (right)
For over 50 years, quadrupole technology has been employed in a number of applications to separate masses, however in the case of quadruple mass spectrometry (QMS), scientists have a number of options to choose from.
A lot of these options rely on the quadrupole size. The most commonly used quadrupole is the ¼” or 6mm, found in analytical tandem gas chromatograph/mass spectrometers (GC/MS), process gas analyzers, and residual gas analyzers (RGA).
While 6 mm is the most commonly used analyzer, it is not necessarily the ideal choice for many applications. Due to this, Process Insights produce quadrupoles in three different sizes: 6 mm, 9.5 mm and 19 mm or ¾”.
The 19 mm quadrupole is the most popular product from Process Insights. Scientists who are new to QMS may find choosing from the various sizes of quadrupoles a difficult task.
Understanding the advantages of different quadrupole sizes can help a scientist to make the right choice. Various factors, including mass range, transmission, resolution, and sensitivity differ depending upon the size of the quadrupole.
Process Insights systems offer one major advantage. The RF/DC power supply in the Process Insights systems has a fixed power output. This removes the need for additional power requirements when switching between different quad sizes; the same power can be uniformly used across all quad sizes.
Experiment
Sensitivity (mA/Torr)
A spherical vacuum chamber with three different mass spectrometer probes was used to conduct the sensitivity tests. In order to create a room air leak of nearly 5 x 10⁻⁶ Torr and measure the nitrogen signal on m/z 28, a metering valve was employed in the sampling technique.
This signal was subsequently resolved to an insignificant mass of a 1 amu width and adjusted for the highest intensity. From this signal, the baseline, with the ion source turned off, was subtracted, followed by subtracting the background chamber pressure from the sample pressure.
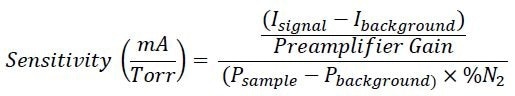
Keeping the ion source turned on, data was obtained for about 30 seconds and with ion source turned off, the same was collected for about 30 seconds. The following equation was then applied to measure the sensitivity of individual mass spec in mA/Torr:
| Where: |
| Isignal= |
Signal intensity (in mV) of m/z 28 with the ion source powered on |
| Ibackground= |
Signal intensity (in mV) of m/z 28 with the ion source powered off |
| Preamplifier Gain= |
Gain resistor of the preamplifier (in Ω) |
| Psample= |
Sample pressure (in Torr) |
| Pbackground= |
Background chamber pressure (in Torr) |
| %N2= |
Partial pressure of nitrogen (in %) in the sample (78.08%) |
Mass Spec #1 (19 mm quad – MAX-QMS) - acquired data scanning from m/z 27 to m/z 29 using a 0.5-second scan rate, along with a 190 sample prescan. This resulted in 20 “microscans” of 50 samples/mass at an actual scan time of 0.481. The Faraday plate detector connected to the conversion dynode was used to collect all the data.
Mass Spec #2 (9.5mm quad – MAX-LT) – obtained data scanning between m/z 26 and m/z 30 using a 0.5-second scan rate, together with a 100 sample prescan. This resulted in 20 “microscans” of 50 samples/mass at an actual scan time of 0.497. Again, the Faraday plate was used to collect all the data.
Mass Spec #3 (6mm quad – Process Insights RGA) – collected data scanning from m/z 23 to m/z 34 with a scan speed of 500 samples per second, along with 20 samples/amu. The auto zero function of the probe was set to “every sample”, which resulted in scan times of about two seconds. The Faraday plate was used to obtain all of the data.
Transmission (%)
A spherical vacuum chamber (Process Insights Serial No: 01876) integrated with three separate mass spectrometer probes was used to perform the transmission tests. In this sampling technique, a metering valve was also used to create a room air leak of nearly 5 x 10⁻⁶ Torr and determine the highest ion signal while scanning between m/z 23 and 34 ions.
This signal was overcome to a small mass of a 1 amu width and adjusted for the highest intensity. Next, the resolution was reduced evenly across the scan range, until the lowest solution was achieved without any overlapping of peaks between oxygen and nitrogen signals.
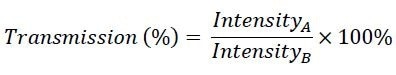
With the low (open) resolution, data was collected for about 30 seconds, and with the high (closed), nominal resolution the same was collected for nearly 30 seconds. The equation given below was applied to measure the transmission of individual mass spec in percent:
| Where: |
| IntensityA= |
Signal intensity (in mV) of the scan using nominal resolution (1-amu wide peaks) |
| IntensityA= |
Signal intensity (in mV) of the scan using low resolution (maximum peak width prior to interference due to overlapping) |
Mass Spec #1 (MAX-QMS) – gathered data scanning between m/z 23 and m/z 34 using a 0.5- second scan rate, in tandem with a 190 sample prescan. This resulted in 8 “microscans” of 50 samples/mass at an actual scan time of 0.481. The Faraday plate detector connected to the conversion dynode was used to obtain all of the data.
Mass Spec #2 (MAX-LT) – obtained data scanning between m/z 23 and m/z 34 through a preferred scan rate of 0.5 seconds, together with a 100 sample prescan. This resulted in a 9 “microscans” of 50 samples/mass at an actual scan time of 0.476. The Faraday plate was used to obtain all of the data.
Mass Spec #3 (Process Insights RGA) – collected data scanning between m/z 23 and m/z 34 with a requested scan speed of 500 samples per second with 20 samples/amu. The auto zero function of the probe was set to “every sample”, which resulted in a scan time of about two seconds. The Faraday plate was used obtain all the data.
Maximum Resolution (M/ΔM)
A spherical vacuum chamber (Process Insights Serial No: 01876) equipped with a pair of mass spectrometer probes was used to perform high resolution testing. A metering valve to bleed UHP Argon, as well as Mass Spec #1 and Mass Spec #2 were integrated into the chamber.
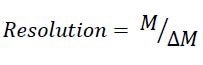
Testing was carried out on Mass Spec #3 with a cylindrical vacuum chamber along with a 0.05”, differentially pumped, restrictive tubing inlet to bleed UHP Argon within the chamber. The argon pressure was raised to obtain about a 5 x 10⁻⁶ Torr chamber pressure. At m/z 40, argon was scanned and the tune for individual mass spec was improved to obtain maximum resolution on the peak. The following equation was used to measure the resolution:
| Where: |
| M = |
Mass of the ion measured in amu |
| ΔM = |
Full width of the ion measured at half of the maximum intensity, in amu (Full Width Half Max) |
Mass Spec #1 (MAX-QMS) – obtained data scanning between m/z 39.7 and 40.3 amu using a 1-second scan rate, in tandem with a 100 sample prescan. This resulted in 30 “microscans” of 500 samples/mass at an actual scan time of 0.982. The electron multiplier detector was used to collect all of the data.
Mass Spec #2 (MAX-LT) – acquired data scanning between m/z 39.7 and m/z 40.3 using a 1-second scan rate, along with a 100 sample prescan. This led to 16 “microscans” of 1000 samples/mass at an actual scan time of 976. Again, the electron multiplier detector was used to obtain all of the data.
Mass Spec #3 (Process Insights RGA) – collected data scanning between m/z 39 and m/z 41 with a scan speed of 500 samples per second, together with 20 samples/amu. The auto zero function of the probe was set to “every sample”, which resulted in a scan time of approximately two seconds. The Faraday plate was used to collect all the data.
Results
Sensitivity (mA/Torr)
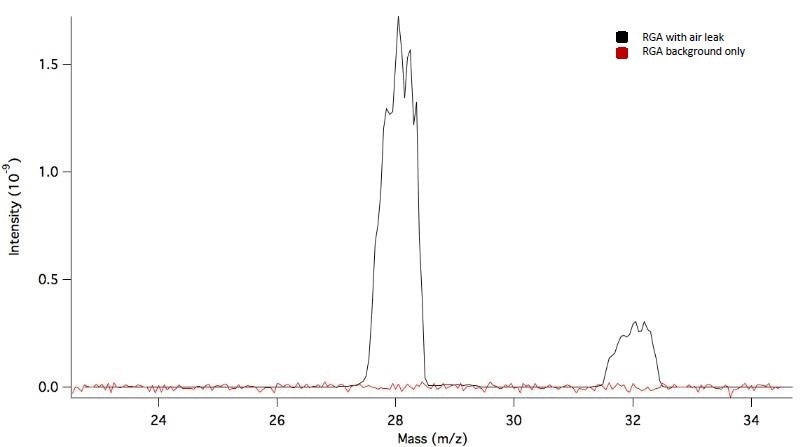
Figure 2. Example of the milliamp per Torr test that is performed to quantify the general sensitivity of a gas analyzer. This example shows the background spectra taken versus the 1 x 10⁻⁶ Torr spectra taken once an air leak was added to the system.
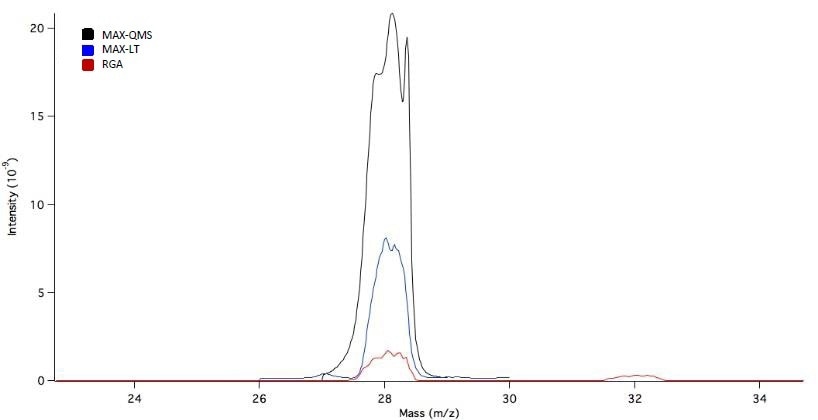
Figure 3. Representative spectra for the three quadrupole sizes used in the testing of total transmission of the systems. The signal is first optimized, then switched to RF only mode to measure the amount of signal lost compared to the amount of signal generated by the ionizer
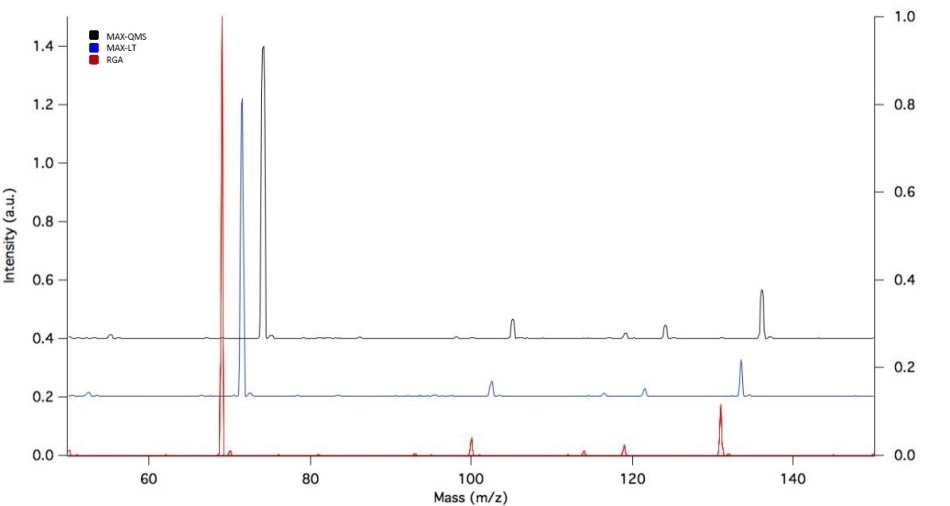
Figure 4. Waterfall plot of the three quad size spectra for the mass range from mass 50 to 150.
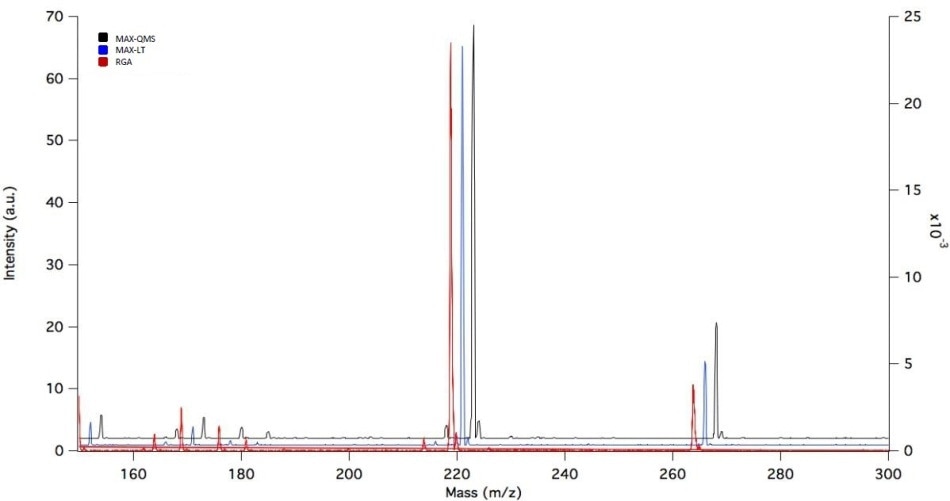
Figure 5. Waterfall plot of the three quad size spectra for the mass range from mass 150 to 300.
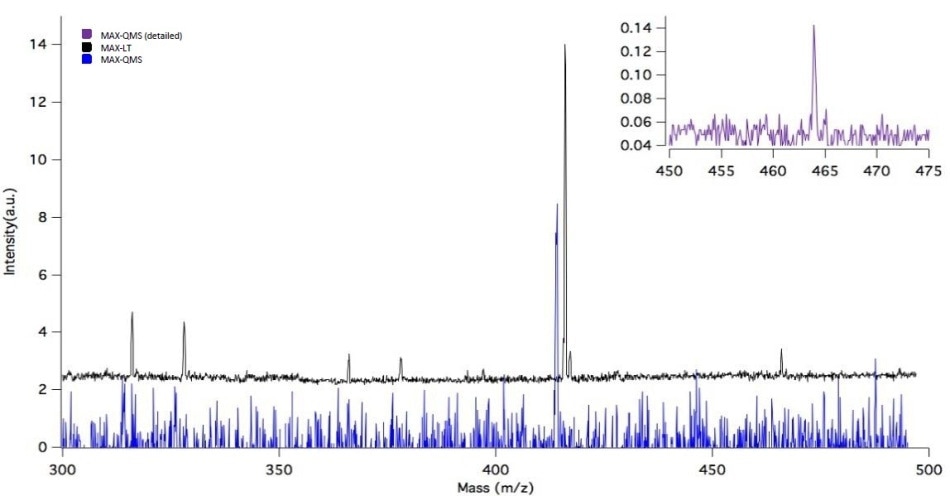
Figure 6. Waterfall plot of the MAX-QMS and MAX-LT for the mass range of 300 to 500amu. Note that the RGA maxes out at 300amu. Inset shows the signal and less than 1amu resolution at 464 m/z for the MAX-QMS.
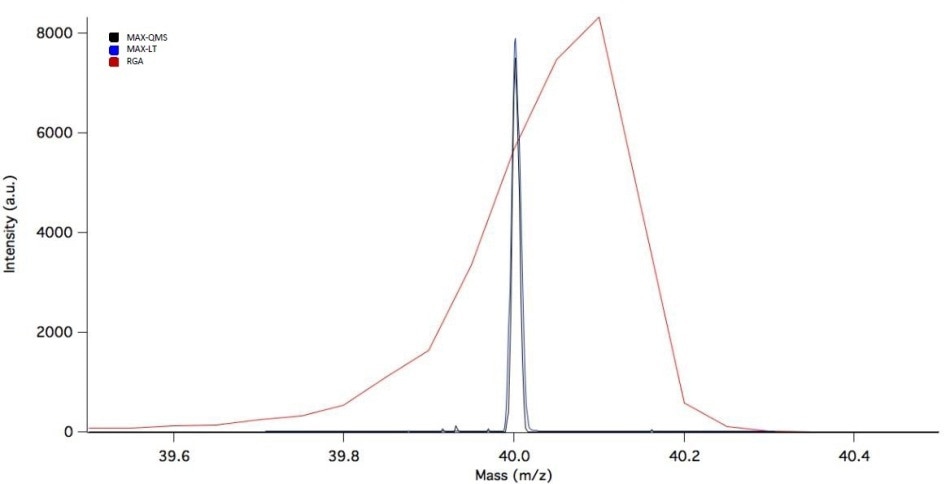
Figure 7. Comparison of resolution at mass 40 for Argon for the three quad sizes.
Tables 1 to 3 show sensitivity values, transmission (%) values, and resolution values, respectively.
Table 1. Sensitivity values
| 19 mm Quad - MAX-QMS |
9.5 mm Quad – MAX-LT |
6 mm Quad – Process Insights RGA |
Isignal = 2084.25 mV
Ibackground = 0.15 mV
Preamplifier Gain = 108 Ω
Psample = 7.75 ×10⁻⁶ Torr
Pbackground = 6.5 x 10⁻⁷ Torr
%N2 = 78.08 % |
Isignal = 4054.86 mV
Ibackground = 14.75 mV
Preamplifier Gain = 109 Ω
Psample = 6.01 ×10⁻⁶ Torr
Pbackground = 1.4 ×10⁻⁷ Torr
%N2 = 78.08 % |
Isignal = 1.721 ×10⁻⁹ A
Ibackground = 2.364 ×10⁻¹³ A
Psample = 6.31 ×10⁻⁶ Torr
Pbackground = 1.0 ×10⁻⁷ Torr
%N2 = 78.08 % |
| Sensitivity: 3.76 mA/Torr |
Sensitivity: 0.88 mA/Torr |
Sensitivity: 0.35 mA/Torr |
Table 2. Transmission (%) values
| 19 mm Quad – MAX-QMS |
9.5 mm Quad – MAX-LT |
6 mm Quad – Process Insights RGA |
IntensityA = 2144.78 mV
IntensityB = 2959.80 mV |
IntensityA = 2761.03 mV
IntensityB = 8192.02 mV |
IntensityA = 1.24 ×10⁻⁹ A
IntensityB = 4.30 ×10⁻⁹ A |
| Transmission = 72.5% |
Transmission = 33.7% |
Transmission = 28.8% |
Table 3. Resolution values
| 19 mm Quad – MAX-QMS |
9.5 mm Quad – MAX-LT |
6 mm Quad – Process Insights RGA |
| 0.00838 amu (FWHM) |
0.0125 (FWHM) |
0.187 amu (FWHM) |
| Resolution (m/Δm )= 4773 |
Resolution (m/Δm) = 3200 |
Resolution (m/Δm) = 214 |
Conclusion
The size of the quadrupole directly influences the transmission and maximum resolution. Both the transfer of ions and the space for separating the ions improve considerably when the size of the quadrupole is bigger.
Depending upon the mass range of their research, scientists must choose the biggest quad within the range. The fixed frequency QPS of Process Insights’ systems provides a stable signal and enables a user to change between different mass ranges easily by merely changing one box.

This information has been sourced, reviewed and adapted from materials provided by Process Insights - Mass Spectrometry.
For more information on this source, please visit Process Insights – Mass Spectrometers.