Raman technology is used as a molecular fingerprint to identify specific molecules, to predict the chemical concentrations in mixtures, and to analyze molecular structures. This is possible due to the highly selective, unique chemical signatures present in Raman spectra, and the fact that the intensity of Raman peaks is proportional to the associated compound concentration.
Raman technology’s non-destructive nature and the fact that sample preparation is not required for testing, have made Raman spectroscopy a go-to technique for analysis in real-world applications. Raman technology has already advanced into the development of portable Raman systems with lab-grade performance.
For instance, in rapid identification of unidentified chemical compounds, raw material verification, quantitative analysis in mixtures and mixture identification, Raman has been extensively used by chemical companies, pharmaceuticals, and safety and security agents worldwide.
Additionally, the peak intensity ratio between two Raman signature peaks can also offer practical data on material crystallinity, material structure disorder, and phase transition.
This article discusses portable Raman for at-line characterization of carbon black. Raman spectroscopic analysis can be an effective test to characterize carbon black material due to the unique data contained in the peak ratio between the D- band and G-band of sp2 carbon material.
A portable Raman spectrometer was used for this study, which highlights the versatility of Raman spectroscopy and the potential impact that the advanced portable Raman spectrometers will have on a variety of industries.
Carbon Black Materials
Carbon black material is graphite in an amorphous structure, but with a reduced level of crystallinity compared to graphite. It is often used as a reinforcing filler in automobile tires and other rubber products, and is also used in paint, pigments, and carbon paper.
Due to the lack of definitive standard test techniques and the complexity of the material structure, material characterization is relatively restricted to traditional tests. These tests include particle size estimated from the surface area values, surface area, iodine adsorption numbers for evaluation of carbon black grades, and dibutyl phthalate (DBP) absorption numbers to establish the relative quantity of oil that carbon blacks can absorb.
While there are technologies that can show the structure of the carbon black material on the atomic level - such as high-performance imaging analysis or X-ray diffraction analysis - none of these techniques allow rapid and convenient at-line or on-line real-time testing on the molecular level that might help assess, control and monitor the carbon black manufacturing process.
The carbon microstructure is highly Raman active, making Raman uniquely suited to test carbon materials in varied crystal structures. Graphite has hexagonal planes of carbon atoms, with four carbon atoms in a single unit cell. The different planes are linked by rotations or translations around the symmetry axis.
For the single crystal graphite symmetric group D6h, one of the vibrational modes E2g is strongly Raman active and is linked with a Raman peak at 1582 cm-1 (G-band).
Consequently, graphite with highly single crystallinity - known as highly ordered pyrolytic graphite (HOPG), only shows a Raman peak at 1582 cm-1. Figure 1 illustrates the graphite structure of the E2g mode that is linked with the G-band. In the case of the carbon black material with amorphous microcrystalline structures, another peak around 1350 cm-1 (D-band) will also emerge.
It has been decided that the peak at 1350 cm-1 is due to the structure disorder close to the edge of the microcrystalline that deforms the structure of the symmetry.
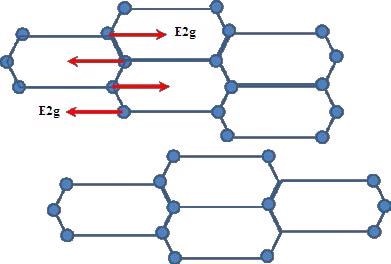
Figure 1. E2g vibrational mode of carbon atoms in one graphite layer
The Raman peak intensity ratio of ID/IG can be used to describe the degree of disorder of the graphite materials. Researchers also consider that the ID/IG is inversely proportional to the grain size of the carbon black materials for grain sizes larger than 2 nm4.
Figure 2 illustrates Raman spectra of three different carbon black samples with the noted G-band and D-band, collected using the portable Raman spectrometer i-Raman Plus with 532 nm laser excitation.
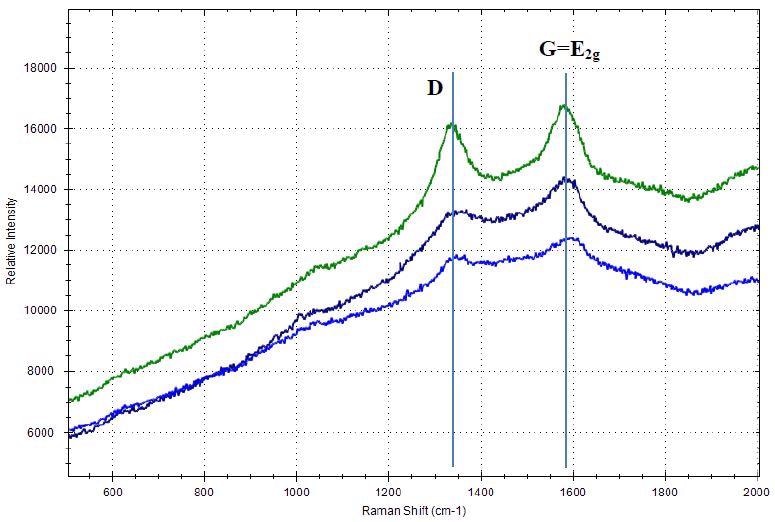
Figure 2. Raman spectra of carbon black materials with D-band and G-band
Experiment
Carbon black materials that are currently available in the market were characterized by Raman spectroscopy using B&W Tek’s portable Raman spectrometer, i-Raman Plus® with a 532 nm laser excitation and spectral resolution at 4.5 cm-1.
A portable video microscope sampling system is integrated with the portable i-Raman Plus system to enable accurate laser focus on the sample surface. A picture of the experimental setup is illustrated in Figure 3.
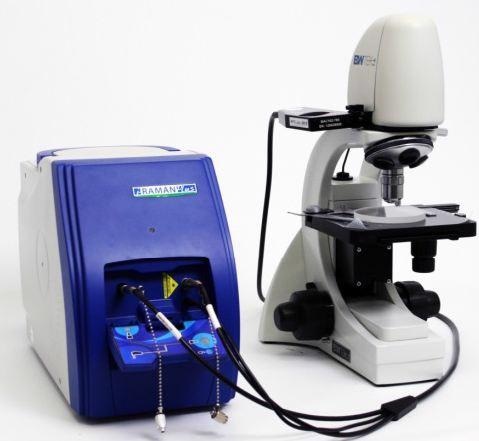
Figure 3. Experiment setup
The Raman spectra were gathered at room temperature with an incorporation time of 120 seconds using laser power of about 40 mW.
Due to of the low efficiency of the Raman phenomenon (10-8), it is very important that the dark noise and readout noise for the CCD detector in a Raman spectrometer stay much lower than the Raman signal. A back-thinned CCD detector consisting of TE-cooling to -2ºC is used in the i-Raman Plus.
Compared to a traditional front illuminated CCD with a quantum efficiency about 50%, the back-thinned CCD quantum efficiency can attain up to 90% with photons entering from the CCD’s backside where the Si substrate is etched thin to improve the light contacting the CCD active area.
This can fundamentally increase the quantum efficiency by decreasing the photon loss. The TE-cooling of the CCD device efficiently decreases the dark noise: the dark noise halves for each 7ºC reduction in device temperature.
The cooled detector allows a long incorporation time, like the 120 seconds in the experiments conducted in this study. This significantly raises the detection limit and makes some of the low-light level applications achievable.
The software BWSpec™ was used for data analysis, which includes peak analysis and baseline correction. Any fluorescence that might come with the Raman signal can be eliminated by the baseline correction function in BWSpec, which is based on a novel algorithm adaptive iteratively reweighted Penalized Least Squares (airPLS).
With the airPLS algorithm, weights of sum squares errors (SSE) are iteratively modified between the fitted baseline and original signals, while the weights of the SSE are tailored using the difference between the former fitted baseline and the original signals. The Raman spectrum of carbon black before and after the airPLS baseline correction is demonstrated in Figure 4.
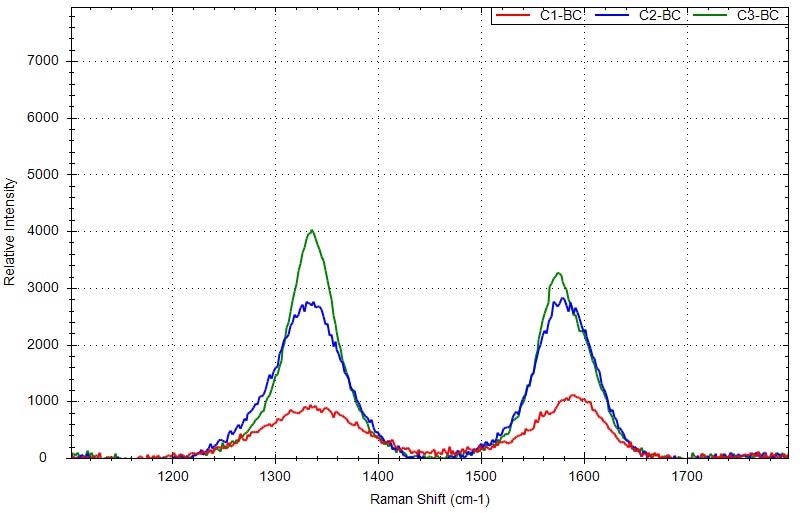
Figure 4. Raman spectrum of carbon black before and after the baseline correction
After the baseline correction, the Raman peak intensities can be acquired easily using the peak analysis function of the software. The Raman peak intensity ratio of the G-band and D-band can then be calculated. The Raman spectra of three different carbon black materials after baseline correction are shown in Figure 5.

Figure 5. Raman spectra of carbon black samples after the baseline correction with different ID/IG: red is for C1, blue is for C2, green is for C3.
The G-band and D-band peak positions, peak ratio ID/IG, and peak intensities of three samples are calculated and displayed in Table 1. A feature of the D-band that makes it highly interesting is that the D-band position is not autonomous of the excitation laser wavelength.
It was revealed that the D-band peak position is shifted from 1360 cm-1 to 1330 cm-1 when the laser excitation shifted from 488 nm to 647 nm.
As shown in the experiment, the D-band peak position is about 1337 cm- 1 when using 532 nm laser excitation. For sample C1 and C2, the ID/IG ratios are less than one, revealing that these carbon black materials have a small degree of disorder, which is in the typical range of graphite rod (C1) and graphite powder (C2).
The ID/IG ratio is larger than one for sample C3, indicating that the degree of disorder is higher for this sample.
Table 1. Peak info of the D-band and G-band for three carbon black samples with 532 nm laser excitation
| Sample |
D (cm- 1) |
G (cm- 1) |
ID |
IG |
Peak Ratio ID/IG |
| C1 |
1337 |
1586 |
909.4 |
1120.5 |
0.81 |
| C2 |
1337 |
1581 |
2763.1 |
2828.1 |
0.98 |
| C3 |
1336 |
1574 |
4022.5 |
3263.2 |
1.23 |
Conclusion
The Raman spectrometer’s high sensitivity offers a quality spectrum of carbon black materials with unique D-bands and G-bands, enabling correlations between the structure and the Raman spectra to be established.
The G-band illustrates the level of order of graphite in its solo crystalline form. The existence of a D-band is linked to the level of disorder of the crystal structure with decreased symmetry of the sp2 carbon.
The ratio of ID/IG can be used to describe carbon black material in various aspects, including:
1) An estimation of the grain size of the carbon black materials
2) The degree of disorder of the carbon black
3) Batch consistency when numerous measurements are taken at various locations of the materials
As portable Raman spectrometers can provide an excellent spectrum, it is possible to conduct at-line or on-line analysis of carbon black materials. This will be advantageous to carbon black manufacturing for process control and process monitoring.
Unlike large bench-top lab-grade Raman spectrometers that cannot be effortlessly placed on-line or at-line for real time analysis, the new generation portable Raman spectrometers have shown a huge potential in industrial applications and will have a more significant role in the near future.

This information has been sourced, reviewed and adapted from materials provided by B&W Tek.
For more information on this source, please visit B&W Tek.