There are various reasons to measure the spectroscopic characteristics of biological systems. Stained/native cells and tissues absorb and release light, leaving clear spectral signatures. Spectroscopy is a versatile tool that helps to detect and measure substances through this unique fingerprint spectrum, and can be considered a type of "chemical vision".
The onset and nature of neoplasia can be determined by measuring, for example, the slight changes in the spectral profiles of cytological and histological samples, or even of in vivo tissue using fiber-optic probes. The status of retinal disease can also be checked through spectroscopic detection.
Imaging Techniques
In fluorescence microscopy, several fluorescent probes are used to label living or fixed cells. Each probe is specific to a certain intracellular component. The challenge is to isolate the distinct yet spectrally overlapping signals from this series of fluorescent labels to create an accurate, quantitative, and high-contrast representation of the concentration, location, and interactions of the intracellular components being analyzed.
This is a justifiable challenge, because in the post-genomic era contemporary methods involving multi-labeling are redefining how key proteins function, cellular physiological mechanisms, and related disease states are studied and interpreted.
Although Raman spectroscopy is an intrinsically weak phenomenon, Raman bands possess extremely narrow bandwidths compared to standard fluorescence bands.
Raman is suitable for spectral discrimination of multiple species that are spatially overlapped and is more powerful when coupled with multi-variate and deconvolution analysis.
The perception of spectral imaging, which creates quantitative 2D spatial images across a third spectral dimension to create a "data cube", was initially supported within the satellite imaging and airborne surveillance fields to create spectroscopic data describing the chemical composition of test areas.
In this type of configuration, a line of the incoming signal may be focused on an imaging spectrograph, where the resulting spectrally dispersed light from that line is cast over an area of the imaging CCD. While the CCD is operating at an adequately fast frame rate, the airborne craft and the connected detection system is scanned across the ground surface and 3D data is built up quickly. Following this, the data cube can be visualized in two principle ways:
- A set of distinct single wavelength images can be produced
- A spectrum from any spatial point on the image can be derived
When the spectrum is dispersed across many spectral channels, the method is called multi- or hyper-spectral imaging. The development of the spectral imaging technique within areas such as surveillance has been ongoing for over two decades, and most of the data produced can be used to resolve biological challenges.
Multi-Spectral Imaging
Within the field of fluorescence microscopy, especially on living cells, multi-spectral imaging helps to acquire full and complete dynamic data from comprehensively labeled samples. Quantitative spectral "unmixing" algorithms can be used to deconvolve the spectra from each image point into its constituent emitting species and their relative contribution.
Unmixing can be effectively applied to cases where there is a major spectral overlapping of several dyes. This allows the use of fluorescent proteins such as GFP and its most common mutations, YFP, CFP and ds-RED in fluorescence resonance energy transfer (FRET) and co-localization methods (Figure 1).

Figure 1. Schematic representation of overlapped fluorescent protein emission spectra. Typically broad autofluorescence is also shown.
FRET is especially prone to considerable spectral "cross-talk". To achieve efficient FRET, a substantial degree of overlap should exist between the absorption spectrum of the acceptor and the emission spectrum of the donor dye.
This condition is often inextricably accompanied by significant overlie of the two emission spectra, as is the case for the standard FRET pair GFP/YFP.
Fluorescence Resonance Energy Transfer
Successful FRET can be carried out by employing a mixture of narrow band filters and dividing the spectrally discrete images onto the two cameras or adjoining fields of view inside the same camera. The effects of cross-talk can be reduced by exciting the acceptor and donor species and then unmixing from just two "filter-based channels".
Through this technique, fast and concurrent imaging of two or three fluorophores can be achieved. Cross-talk becomes a major problem in situations where a greater number of fluorophores have to be dealt with, and particularly when fluorophores are more spectrally overlapped.
In such cases, more spectral channels are required to isolate the signals effectively. However, instead of using narrow band filters to isolate the signal from closely overlapping fluorophores, rapid multi-spectral imaging could be performed and the entire unfiltered emission spectra can be collected, followed by unmixing.
If such a configuration is achieved, then better signal to noise images can be realized as it is not neccessary to discard most of the discharged photons through narrow band filters. Any autofluorescence from the sample can be separated and removed through spectral imaging and unmixing.
Although this type of approach provides substantial benefits with regard to multi-spectral image separation, many technical challenges also exist. Several key attributes will be present in the ideal spectral imaging system.
This type of system would be able to collect spectral data for the creation of data cubes in a rapid manner, allowing the throughput and analysis of dynamic samples. The spectral imaging system would be adequately sensitive in terms of maximum detector Quantum Efficiency (QE), minimal detector noise, and high optical throughput to produce a high signal to noise (S/N) - it has been demonstrated that efficacy of spectral unmixing is considerably greater under such situations.
Sufficient spectral resolution is required to enable effective isolation of the constituent contributing samples - the number of spectral channels needed is powered by
- the number of contributing overlapped species
- if existing reference emission spectra can be used for unmixing or whether "unknowns" are being recorded
As described above, there is no need to discard photons to obtain the preferred spectral resolution and separation if the entire overlapped spectrum over the wavelength range has to be collected and prevent the use of narrow band filters as the detection channels. This approach results in better resolution, higher S/N, and more accurate quantification.
EMCCD Technology
The EMCCD technology from Andor can be integrated into the ultra-sensitive spectral imaging set-up. The unique S/N is much greater than that provided by traditional CCD cameras functioning at fast readout speeds.
As EMCCD is a fast-readout imaging device, it produces frame rates that are suitable for recording faster data cubes or for dynamic FRET events.
In all direct imaging studies of living cells, it is preferred to preserve the living subject as long as possible by reducing damage to phototoxic cell/tissues and photo-bleaching of the integrated fluorophores. As such, EMCCD detection technology significantly benefits the techniques.
EMCCD has the required speed and sensitivity to capture with high spectrally resolved and S/N image sets from weakly emitting species and also allows the attenuation of laser excitation power. The rates of cell phototoxicity and dye photo-bleaching are considerably reduced through minimization of excitation powers.
In the conventional method of spectroscopically resolving wavelengths with CCDs, a dispersive element such as a grating is used, which will cast the wavelength separated light across a single dimension of the array. Dedicated spectroscopic CCD formats are available specifically for this type of application - such formats are likely to have an extended shape, with standard pixel formats being 1600 x 200 or 1024 x 128.
In standard spectroscopy readout mode, the light is distributed along the longer horizontal dimension providing > 1000 "spectral channels" and the vertical columns are binned on a chip, producing a larger light collection area and expediting the obtainable spectral frame rate.
Andor’s advanced iXon3 EMCCD cameras feature imaging sensor formats such as 1000 x 1000 or 512 x 51. These pixel formats have been designed for use in typical spectroscopic mode, executing extensive vertical binning along the vertical column dimension.
Andor's NewtonEM EMCCD camera is a new dedicated spectroscopy EMCCD camera. This USB 2.0, -90°C thermoelectric (TE) cooled platform comes in either 1600 x 128 or 1600 x 256 pixel formats, and has been adapted for fast low-light spectroscopic applications.
Spectral Imaging Spectrograph
There are other useful ways of reading out EMCCDs spectroscopically, for instance, an imaging spectrograph such as Andor's Shamrock 303i could be used, which will provide spatial resolution along the dimension of the entrance slit. It is possible to read out the EMCCD as an absolute image, with a spectral resolution along the vertical spatial and horizontal axis dimension perpendicular to this.
Figure 2 shows a spectral dispersion from a line illumination. In addition, the sensor can be read out in several horizontal tracks down the array, of software-configurable position and size, with each one yielding an individual spectrum, for instance, corresponding to the input of an optical fiber from a point in the sample.
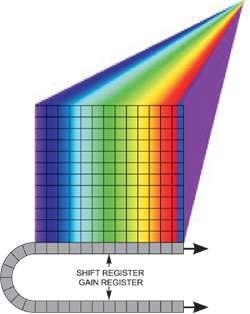
Figure 2. Spectral dispersion from a line illumination
Two options are available if unusually fast spectral rates have to be achieved, but for each option light should be dispersed only across a restricted number of rows on the sensor without any light falling on the rest of the active area. Reading out an imaging EMCCD in "fast kinetics mode" helps to acquire the fastest time resolution (Figure 3).
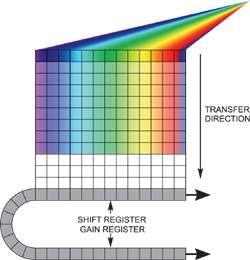
Figure 3. Fast kinetics readout
In this configuration, the spectrum is distributed across several rows at the top of the sensor. The "dark rows" underneath are then employed to store the spectra that moved down from the exposed area. This continues until the entire sensor is filled.
The entire area is read out as normal, and multiple spectra are processed by the software. It is possible to achieve time resolution down to the time taken to move these rows down by a single step, which in the Andor iXonEM+ EMCCD range can be adjusted to < 1 µs/row, with up to 1999 storage rows.
If the experiment requires fast spectral time resolution but cannot be limited by the sensor’s storage size, then the EMCCD can be readout in a "cropped sensor" mode (Figure 4). In this mode, the sensor can be tricked into thinking that it is smaller than it actually is, and can be readout constantly at a relatively faster frame rate.
The spectral time resolution is controlled by the time taken to readout the sensor’s smaller defined section. For instance, by directing dispersed light onto a 10 x 1000 area at the base of the iXonEM+ DU885-K at 35 MHz pixel readout, it is possible to readout at tens of thousands of spectra/sec. Several new spectral imaging methods have already been applied that exploit the ultrasensitive and fast readout properties of EMCCDs.
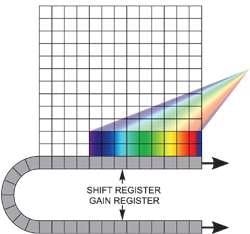
Figure 4. Cropped sensor mode
Multi-Spectral Confocal Scanning
Next-generation multi-spectral confocal scanning is an area that is being addressed. While several commercial systems are available for multi-spectral confocal point scanning microscopy, some are known to have major drawbacks.
A few formats are worth mentioning in particular. In one configuration, a grating has to be used to disperse the confocal signal from indicial scanned points across a linear array of 32 photomultiplier tubes (PMTs). This mainly suffers from the low QE of PMTs, particularly towards the red, and different responses of adjacent channels.
In another commercial format, a single PMT is used for detection and a grating is tilt-scanned across the spectral range during the laser dwell-time on an image point.
It is easy to believe that significant amount of time is involved to conduct spectral scans on >250,000 pixels of a 512 x 512 image. Also, this type of configuration is not suitable for spectral analysis of dynamic systems and also suffers from the unfavorable effects of extensive illumination of the sample.
To resolve these issues, EMCCDs system can be implemented for multi-spectral confocal scanning. This approach is improved by leveraging the >90% quantum efficiency of single photon sensitivity, the back-illuminated sensor, fast pixel readout speed, and array architecture.
The dwell-time of the laser should be set to correspond with the time taken to expose and read-out a short row of about 32 pixels, which are adequate to enable successful unmixing of several known emitting dyes, leading to a data cube of 512 x 512 x 32 that takes less than 1 second to create.
Even with fewer spectral channels, faster speeds can be anticipated. EMCCD pixels provide a distinct sensitivity benefit as opposed to the PMT-technology, which is up to tenfold in the red and circa 5-fold in the blue-green. Multi-spectral imaging in microscopy can also be carried out by using modules that include transmissive dispersion gratings, for example, the Inspector.
In these systems, the optical principle of detection and dispersion is slightly similar to that mentioned earlier for airborne monitoring. This system is placed between the EMCCD and microscope, and light is gathered from an illuminated line in the x-direction over the sample, with the line illumination coming from either the laser or filtered lamp.
The light collected from the line is distributed across the EMCCD array area or even part of the existing area for faster frame rates with lower resolution or spectral range (Figure 5). The pixels across the EMCCD columns offer resolution in λ, and the y-direction is scanned by incrementally shifting the sample through a motorized stage.
For every stage step, the area of the illuminated array should be exposed and readout. The EMCCDs’ ultra-sensitive performance is perfect for this method, allowing faster readout performance as well as shorter exposure times.
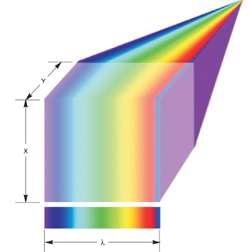
Figure 5. Line scan spectral imaging
Conclusion
The performance of the EMCCD can be readily used to accelerate a spectral imaging approach, where a liquid crystal tuneable emission filter is used to successively attain a λ-stack of images over a spectral range, involving both illumination and imaging of the whole area, wavelength-at-a-time.
This method has often suffered from the speed of acquisition constraints but is considerably increased by the readout speed and sensitivity benefits rendered by the EMCCD technology.
A tuneable wavelength excitation source can also be scanned to perform excitation spectroscopic imaging, examining the ensuing emission intensity. Spectral unmixing algorithms can then be readily applied to the data obtained in this manner.

This information has been sourced, reviewed and adapted from materials provided by Andor Technology Ltd.
For more information on this source, please visit Andor Technology Ltd.