The optical technique Raman spectroscopy is particularly suited for in-situ reaction monitoring in chemical synthesis. However, the technique becomes infeasible when low concentrations are present due to the inherent weakness of the Raman scattering of the reagents in regard to the solvent.
This problem can be overcome using surface enhanced and resonance Raman spectroscopy and other similar techniques to improve the Raman signal of particular reaction components. A team of researchers from the University of Groningen, in the Netherlands, have used the Ultraviolet-Resonance Raman (UV-RR), the details of which are outlined in this article.
The team intended to demonstrate the viability of using UV-RR as an online reaction monitoring method for low temperature catalytic oxidation of organic substrates, such as bleaching, present in aqueous environments. These low temperature catalysts are used in the bleaching of cotton fabric, a significant industrial application.
Viability of UV-RR
The epoxidation of alkenes that were catalyzed by a manganese complex were used to validate the concept model reaction by Abdolahzadeh and team.
In the early 1990s, manganese complexes of the ligand 1,4,7-trimethyl-1,4,7- triazacyclononane (TMTACN) were found to be highly effective catalysts for low temperature bleaching. A user had to deal with low substrate concentrations less than 10 mM because of the low substrate solubility in aqueous conditions. Getting the ‘sensitivity’ to work at these low concentrations is one of the important hurdles in reaction monitoring in these conditions.
Figure 1 shows a schematic of the chemical reaction used for the experiment, displaying the oxidation of 4-vinylbenzoic acid in water with a manganese complex-catalyzed H2O2. The resonance Raman spectrum was recorded and the change in the intensity of particular spectral features that are relative to an internal standard (Na2SO4) was observed to monitor the progress in reaction.
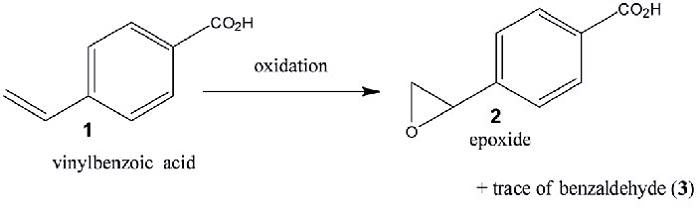
Figure 1. Schematic of the model reaction for demonstrating the technique. 4-Vinyl-benzoic acid is oxidized in water with H2O2 to form the reaction products, an epoxide and traces of the corresponding carboxybenzaldehyde. A manganese complex was used as the catalyst.
Figure 2 shows the major components that were employed in the experimental setup. The specimen solution of with an internal standard (0.05 M Na2SO4) and 1 mM 4-vinyl-benzoic acid dissolved in water after H2O2 was kept in a quartz cuvette (1 cm pathlength 3 mL volume). The manganese catalyst with a final concentration of 0.01 mM was added to this solution at time zero. The reaction was performed at 18°C.
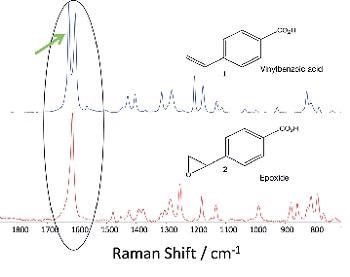
Figure 2. Schematic of the experimental setup in the back-scattering configuration. A picture of the optical layout is included below.
The excitation wavelength was chosen to be 266 nm as it coincides with the strong UV absorption bands of the 4-vinyl-benzoic acid and (to a lesser extent) the epoxide and aldehyde products (see Figure 4 & 5), which enable resonance enhancement of the Raman scattering from the reactant and products. This allows resonance enhancement of the Raman scattering from the products and the reactants.
Quartz prisms and dichroic mirrors, to remove residual 532 nm light, were employed to deliver the 266 nm laser light, which is the fourth harmonic of an Innolas Spitlight200 Nd:Yag ns-pulsed laser (10 Hz, 4 - 5 ns pulse UV-sensitive iDus CCD detector (DU420A- BU2). The BU2 sensor, a AR coated back-thinned sensor, which has been tweaked for the deeper UV circa 250 nm, is ideal for the spectral region.
To stop the Rayleigh scattered light from entering the spectrograph, a long pass filter (266 nm RazorEdge® ultrasteep long-pass edge filter from Semrock) was fixed in front of the entrance slit of the spectrograph. Raman spectra that have acquisitions settings of 2 seconds exposure with 60 accumulations were obtained at 15 minute intervals.
The major Raman feature employed to observe the reaction progress at a Raman shift of 1631 cm-1 was evident in the spectra samples taken on pure specimen of the aldehyde and epoxide products (Figure 5) and 4-vinyl-benzoic acid (Figure 3). Figure 3 shows the spectra produced by the solid state samples excited at 785 nm, while the spectra in Figure 6 were produced from solutions (1 mM).
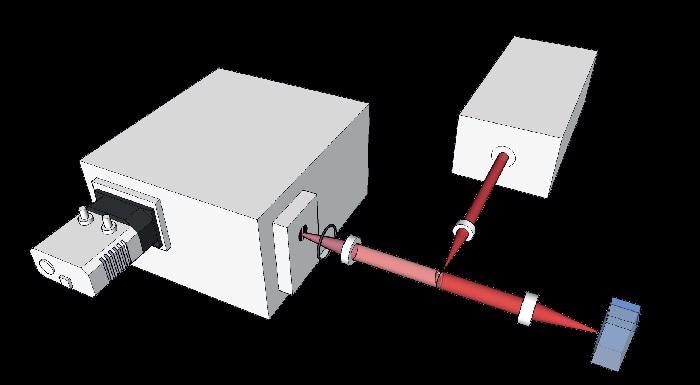
Figure 3. Comparison of the Raman ‘fingerprints’ for the 4-vinyl-benzoic acid and the epoxide product. Spectra were taken on solid state samples using an excitation wavelength of 785 nm. The key feature used for monitoring the reaction kinetics is highlighted at a Raman band around ~ 1631 cm-1.
Figure 4 shows the respective UV absorption spectra.
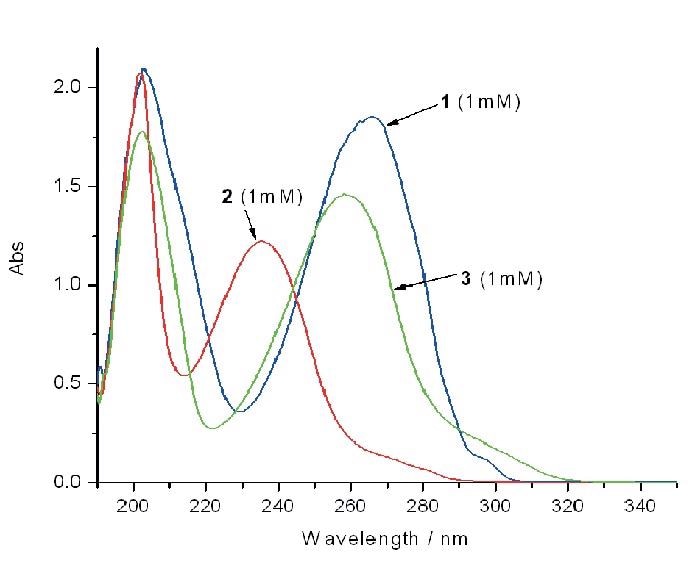
Figure 4. The corresponding UV/Vis absorption spectra are shown in B.
Figure 5 shows a series of spectra that were taken in real experimental conditions at different times with 1 mM concentrations. As the reaction progresses a fall in the intensity of the Raman band at 1631 cm-1 can be observed.
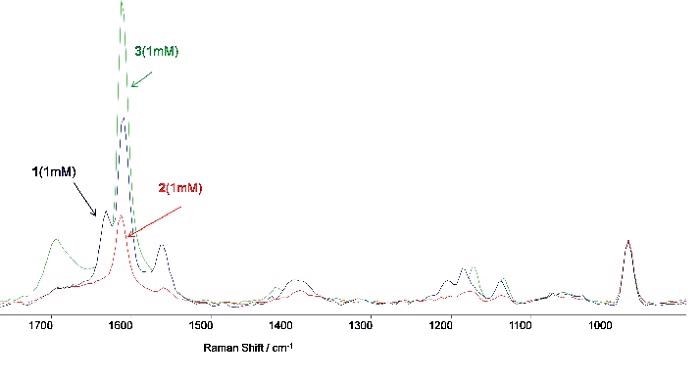
Figure 5. A shows the resonance Raman spectra (in 0.1M NaHCO3 buffer, pH=8) of pure samples of 4 -vinyl-benzoic acid (1, 1mM), the epoxide product (2, 1mM) and the carboxy-benzaldehyde (3, 1mM) product (internal reference Na2SO4 0.25M). Figure 6a: A series of captured Raman spectra illustrating how the variation in intensity of the feature at 1631cm-1 facilitates monitoring of the reaction process through time. The standard Raman band from Na2SO4 (0.05M) is evident on the right. Figure 6b: Variation with time of the intensity of the Raman band at 1631cm-1.
Conclusion
The results of the experiment show the viability of UV-RR spectroscopy as an online real-time reaction monitoring method, especially when reactants with low concentrations (less than 1 mM) are involved. The enhancement and optimization of the signal in resonance Raman and the sensitive multichannel detectors, and efficient light collection in the UV as seen in the BU2 sensor are the important enablers of the screening method.
Some of the key enablers of low concentration species screening techniques are the optimization and enhancement of the signal (as with Resonance Raman), efficient light collection, and sensitive multichannel detectors in the UV and BU2 sensors.
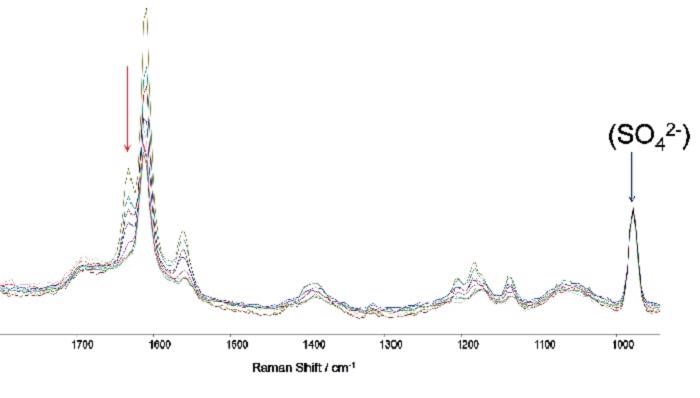
Figure 6a. A series of captured Raman spectra illustrating how the variation in intensity of the feature at 1631 cm-1 facilitates monitoring of the reaction process through time. The standard Raman band from Na2SO4 (0.05M) is evident on the right.
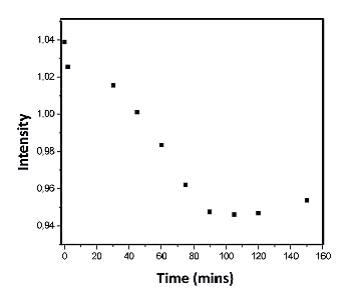
Figure 6b. Variation with time of the intensity of the Raman band at 1631 cm-1.

This information has been sourced, reviewed and adapted from materials provided by Andor Technology Ltd.
For more information on this source, please visit Andor Technology Ltd.