|
The physical properties of titanium and its alloys are summarised in Table 1, from which it can be seen that there is little variation from one alloy to another. For example, coefficients of thermal expansion range from 7.6x10⁻⁶ K-1 to 9.8x10⁻⁶ K-1.
Table 1. Physical properties of titanium and titanium alloys.
|
|
|
Commercially Pure
|
ASTM Grade 1
|
4.51
|
1670
|
0.54
|
56
|
|
Commercially Pure
|
ASTM Grade 2
|
4.51
|
1677
|
0.54
|
56
|
|
Commercially Pure
|
ASTM Grade 3
|
4.51
|
1677
|
0.54
|
56
|
|
Commercially Pure
|
ASTM Grade 4
|
4.54
|
1660
|
0.54
|
61
|
|
Ti-3%Al-2.5%V
|
ASTM Grade 9
|
4.48
|
1704
|
-
|
124
|
|
Ti-0.8%Ni-0.3%Mo
|
ASTM Grade 12
|
4.51
|
-
|
0.54
|
51
|
|
Ti-3%Al-8%V-6%Cr-4%Zr-4%Mo
|
Beta C
|
4.81
|
1649
|
-
|
-
|
|
Ti-15%Mo-3%Nb-3%Al-0.2%Si
|
Timetal 21 S
|
4.90
|
-
|
0.49
|
135
|
|
Ti-6%Al-4%V
|
ASTM Grade 5
|
4.42
|
1649
|
0.56
|
170
|
|
Ti-2.5%Cu
|
IMI 230
|
4.56
|
-
|
-
|
70
|
|
Ti-4%Al-4%Mo-2%Sn-0.5%Si
|
IMI 550
|
4.60
|
-
|
-
|
160
|
|
Ti-6%Al-6%V-2%Sn
|
|
4.54
|
1704
|
0.65
|
-
|
|
Ti-10%V-2%Fe-3%Al
|
|
4.65
|
1649
|
-
|
-
|
|
Ti-15%V-3%Cr-3%Sn-3%Al
|
|
4.76
|
1524
|
0.50
|
147
|
|
Ti-8%Al-1%Mo-1%V
|
|
4.37
|
1538
|
-
|
198
|
|
Ti-11%Sn-5%Zr-2.5%Al-1%Mo
|
IMI 679
|
4.84
|
-
|
-
|
163
|
|
Ti-5.5%Al-3.5%Sn-3%Zr-1%Nb-0.3%Mo-0.3%Si
|
IMI 829
|
4.54
|
-
|
-
|
-
|
|
Ti-5.8%Al-4%Sn-3.5%Zr-0.7%Nb-0.5%Mo-0.3%Si
|
IMI 834
|
4.55
|
-
|
-
|
-
|
|
Ti-6%Al-2%Sn-4%Zr-2%Mo
|
|
4.54
|
1649
|
0.42
|
191
|
|
Ti-6%Al-2%Sn-4%Zr-6%Mo
|
|
4.65
|
1635
|
-
|
-
|
|
Ti-6%Al-5%Zr-0.5%Mo-0.2%Si
|
IMI 685
|
4.45
|
-
|
-
|
-
|
|
Ti-6%Al-3%Sn-4%Zr-0.5%Mo-0.5%Si
|
Ti 1100
|
4.50
|
-
|
-
|
180
|
Table 1 (cont.). Physical properties of titanium and titanium alloys.
|
|
|
Commercially Pure
|
ASTM Grade 1
|
16.3
|
8.6
|
9.2
|
888
|
|
Commercially Pure
|
ASTM Grade 2
|
16.3
|
8.6
|
9.2
|
913
|
|
Commercially Pure
|
ASTM Grade 3
|
16.3
|
8.6
|
9.2
|
921
|
|
Commercially Pure
|
ASTM Grade 4
|
16.3
|
8.6
|
9.2
|
949
|
|
Ti-3%Al-2.5%V
|
ASTM Grade 9
|
7.6
|
-
|
7.9
|
935
|
|
Ti-0.8%Ni-0.3%Mo
|
ASTM Grade 12
|
22.7
|
9.5
|
-
|
888
|
|
Ti-3%Al-8%V-6%Cr-4%Zr-4%Mo
|
Beta C
|
8.4
|
9.4
|
9.7
|
793
|
|
Ti-15%Mo-3%Nb-3%Al-0.2%Si
|
Timetal 21 S
|
7.62
|
4.4
|
4.9
|
785
|
|
Ti-6%Al-4%V
|
ASTM Grade 5
|
7.2
|
8.8
|
9.2
|
999
|
|
Ti-2.5%Cu
|
IMI 230
|
16.0
|
9.0
|
9.1
|
895
|
|
Ti-4%Al-4%Mo-2%Sn-0.5%Si
|
IMI 550
|
7.9
|
8.8
|
9.2
|
975
|
|
Ti-6%Al-6%V-2%Sn
|
|
7.2
|
9.0
|
9.4
|
946
|
|
Ti-10%V-2%Fe-3%Al
|
|
-
|
-
|
9.7
|
796
|
|
Ti-15%V-3%Cr-3%Sn-3%Al
|
|
8.1
|
-
|
9.7
|
760
|
|
Ti-8%Al-1%Mo-1%V
|
|
6.5
|
8.5
|
9.0
|
1038
|
|
Ti-11%Sn-5%Zr-2.5%Al-1%Mo
|
IMI 679
|
7.1
|
8.2
|
9.3
|
950
|
|
Ti-5.5%Al-3.5%Sn-3%Zr-1%Nb-0.3%Mo-0.3%Si
|
IMI 829
|
-
|
9.45
|
9.77
|
1015
|
|
Ti-5.8%Al-4%Sn-3.5%Zr-0.7%Nb-0.5%Mo-0.3%Si
|
IMI 834
|
-
|
10.6
|
10.9
|
1045
|
|
Ti-6%Al-2%Sn-4%Zr-2%Mo
|
|
6.0
|
9.9
|
-
|
996
|
|
Ti-6%Al-2%Sn-4%Zr-6%Mo
|
|
7.1
|
9.4
|
10.3
|
932
|
|
Ti-6%Al-5%Zr-0.5%Mo-0.2%Si
|
IMI 685
|
4.8
|
9.8
|
9.5
|
1025
|
|
Ti-6%Al-3%Sn-4%Zr-0.5%Mo-0.5%Si
|
Ti 1100
|
6.6
|
8.8
|
9.5
|
804
|
Density
The density of an alloy is dependent upon the amount and density of the alloying constituents. For example, an alloy containing aluminium as an alloying element is likely to be substantially lighter than one containing an appreciable amount of tin. Generally, beta alloys are heavy because they contain alloying constituents such as molybdenum which has a relatively high density. Where weight is important, it may be worthwhile to compare specific properties of alloys, e.g. the specific strength.
Strength
In Table 2 the specific strengths of some titanium alloys are compared with those of other structural metals.
Table 2. Strength of some titanium alloys at room temperature, normalised by density, compared with other structural metals.
|
|
|
Commercially Pure
|
ASTM Grade 2
|
78
|
107
|
54
|
|
Ti-6%Al-4%V
|
ASTM Grade 5
|
206
|
226
|
135
|
|
Ti-6%Al-2%Sn-4%Zr-2%Mo
|
|
202
|
223
|
123
|
|
Ti-4%Al-4%Mo-2%Sn-0.5%Si
|
IMI 550
|
225
|
247
|
136
|
|
Ti-10%V-2%Fe-3%Al
|
|
264
|
282
|
155
|
|
Maraging Steel
|
|
170
|
202
|
121
|
|
FV 520 B Steel
|
|
153
|
165
|
105
|
|
13% Cr Stainless Steel
|
|
95
|
105
|
68
|
|
18/8 Stainless Steel
|
|
68
|
75
|
40
|
Thermal Conductivity
The thermal conductivity of all titanium alloys is relatively low for a metal, although recent work has indicated that the value for commercially pure titanium is actually 21.6 W m-1.K-1, about 32% higher than the value quoted in Table 1. The titanium alloys generally have even lower thermal conductivities than the commercially pure material.
Electrical Resistivity
As may be expected from this, electrical resistivity is relatively high. Specific heat does not show any obvious trend, ranging from about 400 to 600 J.kg-1.K-1.
Magnetic Properties
Commercially pure titanium and all the titanium alloys are non magnetic. The permeability of commercially pure titanium is 1.00005-1.0001 at 955 H.m-1.
Elastic Modulus
Values of elastic (Young's) modulus typically range from 80 to 125 GPa, but this depends to some extent on the working process used to produce the material and on the directionality of the test material. There is, however, a general tendency for high aluminium containing materials to have a somewhat higher modulus than other alloys.
Poissons Ratio
It is difficult to give a reliable value for Poisson's ratio for titanium alloys since anisotropy leads to small differences in both elastic and shear moduli which, when taken together to calculate Poisson's ratio can lead to values varying from 0.287 to 0.391 for annealed ASTM Grade 5 (Ti-6%Al-4%V) sheet. However, the generally accepted value for commercially pure titanium is 0.36 and that for ASTM Grade 5 is 0.31.
The Effect of Temperature on the Physical Properties
The effect of temperature on the physical properties of commercially pure titanium is given in Table 3. The alloys follow a similar pattern although the thermal conductivity tends to increase more at elevated temperature, most of the alloys showing increases of 60 to 80% between ambient and 500°C. Other properties follow more closely the trends for commercially pure titanium.
Table 3. Effect of temperature on the physical properties of comeercially pure titanium.
|
|
|
20
|
-
|
17
|
0.48
|
0.50
|
3.4
|
110
|
|
100
|
7.6
|
16
|
0.65
|
0.55
|
3.5
|
101
|
|
200
|
8.9
|
15
|
0.83
|
0.58
|
3.6
|
92
|
|
300
|
9.5
|
15
|
1.00
|
0.595
|
3.7
|
85
|
|
400
|
9.6
|
15
|
1.15
|
0.605
|
3.9
|
78
|
|
500
|
9.7
|
15
|
1.29
|
0.615
|
4.0
|
72
|
|
600
|
-
|
16
|
1.41
|
-
|
-
|
-
|
Tensile Strength
The tensile strength of titanium and its alloys at ambient temperature ranges from 240 MPa for the softest grade of commercially pure titanium to more than 1400 MPa for very high strength alloys. Proof strengths vary from around 170 to 1100 MPa according to grade and condition. Details are given in Table 4.
Table 4. Guaranteed properties of titanium alloys.
|
|
|
Commercially Pure
|
ASTM Grade 1
|
172
|
241
|
50
|
25
|
35
|
103
|
|
Commercially Pure
|
ASTM Grade 2
|
276
|
345
|
50
|
20
|
35
|
103
|
|
Commercially Pure
|
ASTM Grade 3
|
379
|
448
|
50
|
18
|
35
|
103
|
|
Commercially Pure
|
ASTM Grade 4
|
483
|
552
|
50
|
15
|
30
|
104
|
|
Ti-3%Al-2.5%V
|
ASTM Grade 9
|
483
|
621
|
-
|
15
|
-
|
91
|
|
Ti-0.8%Ni-0.3%Mo
|
ASTM Grade 12
|
345
|
483
|
-
|
18
|
25
|
103
|
|
Ti-3%Al-8%V-6%Cr-4%Zr-4%Mo
|
Beta C
|
1104
|
1172
|
-
|
6
|
19
|
103
|
|
Ti-15%Mo-3%Nb-3%Al-0.2%Si
|
Timetal 21 Sa
|
750
|
792
|
-
|
10b
|
-
|
74
|
|
Ti-6%Al-4%V
|
ASTM Grade 5
|
828
|
897
|
55-60
|
10
|
20
|
114
|
|
Ti-2.5%Cu
|
IMI 230
|
400
|
540
|
-
|
16
|
35
|
-
|
|
Ti-4%Al-4%Mo-2%Sn-0.5%Si
|
IMI 550
|
959
|
1104
|
50-60
|
9
|
38
|
114
|
|
Ti-6%Al-6%V-2%Sn
|
|
966
|
1035
|
50-60
|
8
|
15
|
-
|
|
Ti-10%V-2%Fe-3%Al
|
|
1104
|
1241
|
50
|
-
|
-
|
103
|
|
Ti-15%V-3%Cr-3%Sn-3%Al
|
|
966
|
1000
|
-
|
7
|
-
|
103
|
|
Ti-8%Al-1%Mo-1%V
|
|
828
|
897
|
-
|
10
|
20
|
117
|
|
Ti-6%Al-5%Zr-0.5%Mo-0.2%Si
|
IMI 685
|
990
|
850
|
-
|
6
|
-
|
125
|
|
Ti-6%Al-2%Sn-4%Zr-2%Mo
|
|
862
|
931
|
50-60
|
8
|
-
|
114
|
|
Ti-6%Al-2%Sn-4%Zr-6%Mo
|
|
1069
|
1172
|
-
|
10
|
20
|
114
|
|
Ti-5.5%Al-3.5%Sn-3%Zr-1%Nb-0.3%Mo-0.3%Si
|
IMI 829
|
820
|
960
|
50
|
10
|
-
|
120
|
|
Ti-5.8%Al-4%Sn-3.5%Zr-0.7%Nb-0.5%Mo-0.3%Si
|
IMI 834
|
910
|
1030
|
-
|
6
|
-
|
120
|
a = Solution treated, b= typical value
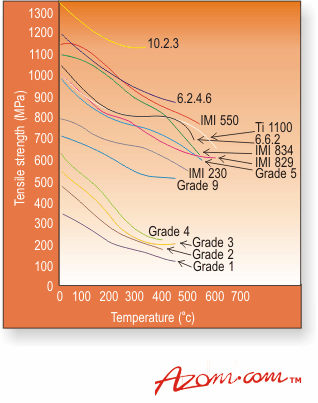
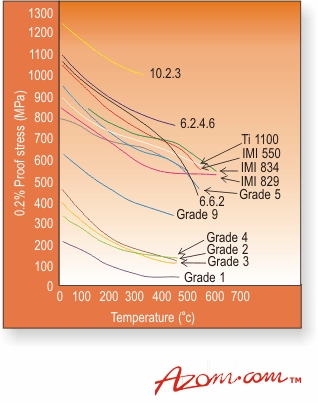
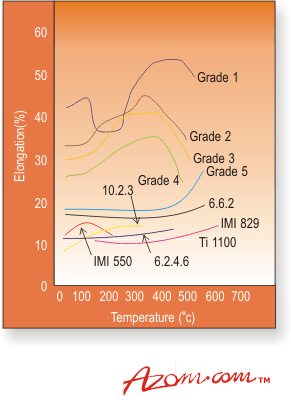
At elevated temperatures each grade of titanium exhibits characteristic tensile properties. The alloy grades, particularly the high strength materials, retain both proof and tensile strengths up to much higher temperatures than the commercially pure grades. This is shown clearly in Figures 1 and 2. Ductility normally increases with increasing temperature, as shown in Figure 3. However, there is a slight irregularity with the commercially pure grades in that ductility increases consistently up to a temperature of between 200°C and 300°C but thereafter decreases until at 400 to 450°C values are very similar to those at room temperature.
|
|
|
Figure 1. Typical values of tensile strength for titanium and its alloys
|
|
|
|
Figure 2. Typical values of proof stress for titanium and its alloys.
|
|
|
|
Figure 3. Typical elongation values for titanium and its alloys.
|
Hardness
The absorption of oxygen into a titanium surface when the material is heated causes an increase in hardness of the surface layer. Grinding and polishing can have a similar effect on metallurgical samples and it is for this reason that hardness values can be misleading. However, the hardness of titanium, if interpreted correctly, can be a useful measurement for the following purposes:
• Hardness can be used to give a rough indication of the identity of a grade of titanium alloy;
• Comparison of hardness before and after annealing can be used to estimate the degree of work hardening initially present or the completeness of annealing depending upon the circumstances;
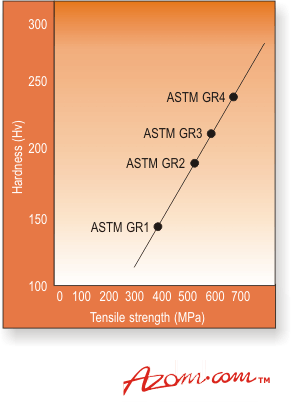
• For certain alloys the relationship between hardness and tensile strength is known. A hardness measurement can therefore be used to give an indication of local mechanical properties, for example, a fragment of a failed component, or alternatively to check the success of a heat treatment.
Figure 4 illustrates the approximate relationship between the hardness of commercially pure titanium and its tensile strength.
|
|
|
Figure 4. Approximate relationship between hardness and tensile strength for commercially pure grades of titanium.
|
Creep
There is little published information on the creep properties of commercially pure titanium, mainly because current applications have not normally required detailed knowledge of this property. Generally, creep values for the material to 0.1% plastic strain in 100,000 hours are approximately 50% of the tensile strength at temperatures up to 300°C.
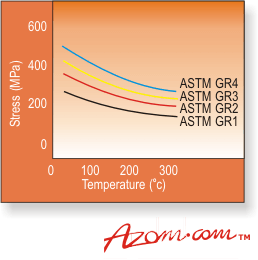
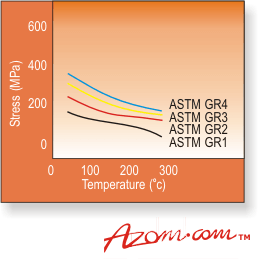
Design codes for chemical plant allow the use of tensile information for equipment operating at up to 150°C, and this covers most of the current uses of commercially pure titanium in the chemical industry. At temperatures above this, titanium is normally used as a lining supported by steel. Chemical plant design codes also refer to stress rupture values and information on these is given in Figures 5 and 6.
|
|
|
Figure 5. 10,000 hour stress rupture curves for commercially pure titanium sheets (Larson-Miller interpolation).
|
|
|
|
Figure 6. 100,000 hour stress rupture curves for commercially pure titanium sheets (Larson-Miller interpolation).
|
Clearly, some applications require the use of material having a good resistance to creep and titanium alloys have been developed over the years to fulfil this requirement. They generally fall into three main categories:
• Alpha-beta alloys. These contain sufficient beta stabilising elements to allow some beta phase to be retained at room temperature. They are heat treated in the alpha-beta phase field and their structure consists of primary alpha and transformed beta. The maximum operating temperature under creep conditions for these materials would normally be 300-450°C;
• Near alpha alloys heat treated in the alpha-beta phase field. By optimising alpha and beta stabilising elements, alloys have been developed which have improved creep resistance at temperatures in the range 450-500°C;
• Near alpha alloys heat treated in the beta phase field. A significant further improvement in creep properties is obtained by heat treating near alpha alloys in the beta phase field and such materials are suitable for use at up to 600°C.
Fatigue
The high cycle fatigue strengths of titanium alloys are generally good in comparison with their tensile strengths. Although the S-N fatigue curves do not show a sharp knee as they do with some metals, they tend to flatten out at about 107 cycles and the fatigue limit thus defined is between 40 and 60% of the tensile strength. The effect of notches is less than could be expected from the stress concentration factors and fatigue crack propagation rates, and residual static strengths of cracked samples compare favourably with those of steels and aluminium alloys. Comparison of specific fatigue strengths of titanium alloys with other high strength materials is included in Table 2.
As with other materials, the fatigue properties of titanium vary with surface finish, notched specimen tests giving substantially lower values than those with unnotched samples. Thus, care is required in design and manufacture to avoid stress concentrators. Poor surface finish, sharp sectional transitions, unblended radii and corners are conditions that should be avoided.
The low cycle fatigue properties of titanium alloys are of relevance to rotating components in aircraft applications. Most data have been generated under constant load, zero minimum stress conditions where it has been established that the fatigue strength of the alloys is closely related to strength and ductility.
Fracture Toughness.
The toughness of titanium alloys is dependent upon strength, composition, microstructure and texture, which properties are interrelated. However, in general terms, the toughness of titanium alloys varies inversely with strength in the same way as that of steels or aluminium alloys. For example, the plain strain fracture toughness of the alpha-beta alloys drops from a value of between 60 and 100 MPa.m-½ at proof stress levels of 800 MPa, to 20 to 60 MPa.m-½ at proof stress levels of 1200 MPa. In general, the heat treatments that are normally used with titanium were originally developed to give optimum tensile properties rather than to improve fracture toughness. However, it has been established that for certain alpha-beta alloys it is possible to increase fracture toughness significantly by simple changes in heat treatment procedure or by a minor variation in alloy chemistry, for example, by reducing the oxygen level in the Ti-6%Al-4%V alloy to produce the extra low interstitial (ELI) grade. Such improvements are generally only associated with small decreases in tensile and fatigue strengths. Other alloy types such as the beta heat treated near alpha alloys have better fracture toughness levels than the alpha-beta types.
|