Dynamic light scattering (DLS) is a proven and mature technology for nanomaterial characterization, while nanoparticle tracking analysis (NTA) is a recent addition to the range of particle characterization techniques.
NTA has many similarities to DLS, causing some confusion as to their relative capabilities. The wide range of measurement capabilities for each method is complementary in nature, delivering a wealth of valuable data. The variations between the two technologies allow the information obtained from one technique to validate and complement the other.
The NanoSight Nanoparticle Tracking Analysis instrument family and the Zetasizer Nano Dynamic Light Scattering instrument range support each other well, providing a range of measurement capabilities useful to Researchers who are interested in the characterization of nanoparticle and bioparticulate systems.
This article discusses how the unique capabilities of these two product ranges, when used together, can provide a more comprehensive understanding than either technique alone.
DLS and NTA are similar techniques as they are based on the Brownian motion of and light scattering from the particle. Also, both techniques apply Stokes-Einstein equation to relate diffusion to size (hydrodynamic diameter). In practice though, they are quite different techniques as DLS provides an intensity-based distribution and NTA produces a number-based distribution.
Additionally, DLS offers an ensemble measurement, whereas NTA delivers a particle-by-particle measurement.
Polystyrene Standards
Analysis of polystyrene latex standards, typically employed to assess the operation of all particle sizing instruments, reveals how well the DLS and NTA techniques agree on measurement of the primary particle size of a sample. In the example given below, using 200 nm polystyrene latex beads, it was shown that the distribution width is slightly different in accordance with each of the techniques.
A narrower distribution is reported by NTA and is in close agreement with the (number-based mean) certified value from the manufacturer. In the case of DLS, a broader distribution is expected for a monodisperse material like this, and the Manufacturer's certificate generally contains an additional set of specifications for DLS measurements.
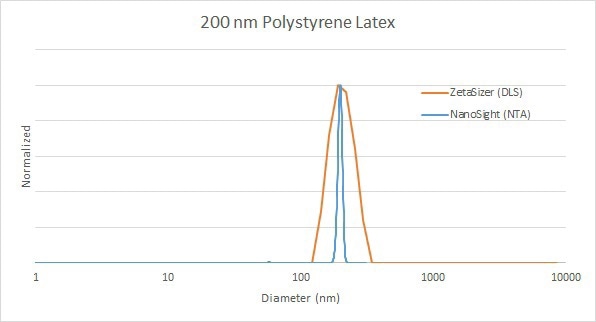
Figure 1. Comparison of 200 nm polystyrene latex standard size distribution analysis by DLS (red) and NTA (blue).
Biological Vesicles
Extracellular vesicles, also known as exosomes or microvesicles, are biological vesicles with a diameter range of 50 - 200 nm. NTA offers a measurement of the total concentration, a key parameter in extracellular vesicle research, in addition to a high-resolution size distribution of the vesicle population.
Here, DLS revealed a broad peak representing the exosomes, and a second peak around 30 nm that was invisible to NTA. The smaller particles observed are not exosomes, but might be of interest in certain applications. DLS is the only technique with the necessary sensitivity to detect such smaller nanoparticles and to report these nanoparticles in a mixture with the primary particles of interest.
In this scenario, DLS can be employed to reveal the total sample composition and NTA can be used to further resolve the peak of main interest in addition to providing the concentration result.
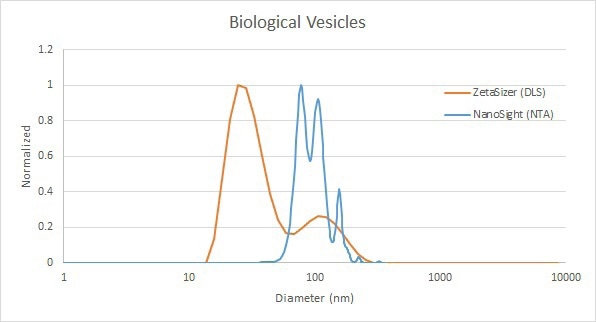
Figure 2. Comparison of biological vesicle measurement results by DLS (red) and NTA (blue).
Antibody-Functionalized Gold Nanoparticles
The first example used antibodies to functionalize 50 nm gold nanoparticles. NTA fully characterized the size distribution that included the small aggregate tail, and provided a total concentration. DLS was able to detect the primary peak, but was also sensitive to a very small number of larger particles.
DLS is an intensity-based measurement and the scattering intensity increases to the sixth power of the diameter, so the approximately tenfold difference in size results in a very bright particle that can be easily determined by DLS, even at very low concentrations. The presence of aggregates can be effectively monitored using DLS.
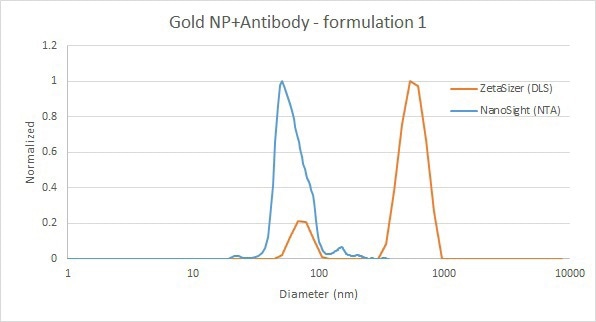
Figure 3. Comparison of gold nanoparticle and antibody mixture measurements by DLS (red) and NTA (blue).
The second example illustrates the analysis of a similar material; however a peak at around 10 nm has also been detected by DLS. This peak is most likely free antibody that did not bind the gold nanoparticles. In this example, the smaller peak can be clearly and reliably determined by DLS, but is below the lower detection limit for the NTA technique.
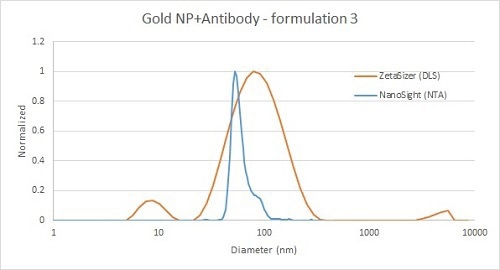
Figure 4. Comparison of gold nanoparticle and antibody mixture measurement by DLS (red) and NTA (blue) - with free antibody detected by DLS only.
Membrane Vesicle Formulations
The analysis of different formulations with differing size distributions by DLS and NTA is shown in the below examples. The first example shows the high-resolution measurement of the primary peak by NTA, whereas a broader distribution intensity is provided by DLS - weighted towards larger particles, as well as the presence of a very low concentration of large particles (Figure 5).
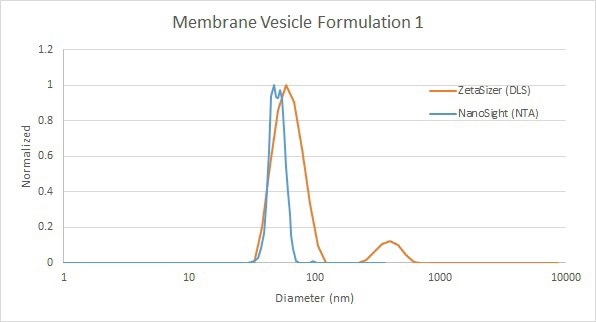
Figure 5. Comparison of membrane vesicle analysis by DLS (red) and NTA (blue).
The second example shows the ability of DLS to detect both the micron-scale aggregates and the free lipid below 10 nm. In this case, NTA has the resolution to provide a highly resolved measurement of the primary peak (Figure 6), representing the vesicles themselves. Therefore, in this example, NTA provides more data about the vesicles and DLS offers additional information about a wider range of constituents present in the sample.
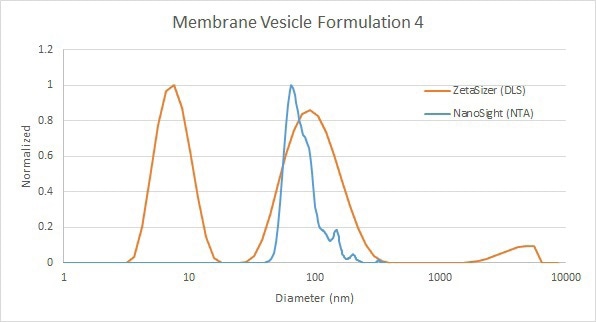
Figure 6. Comparison of membrane vesicle analysis by DLS (red) and NTA (blue) - with free lipid picked up by DLS.
The third example displays a similar sample consisting of both very large and very small particles in the mixture, in addition to a bimodal distribution detected by DLS (Figure 7). NTA measurement of the main peak offers a high-resolution size distribution with multiple modes and a quantitative measure of the large-size tail within that size segment. This resolution offers added value to acquire more precise information about this vesicle peak.
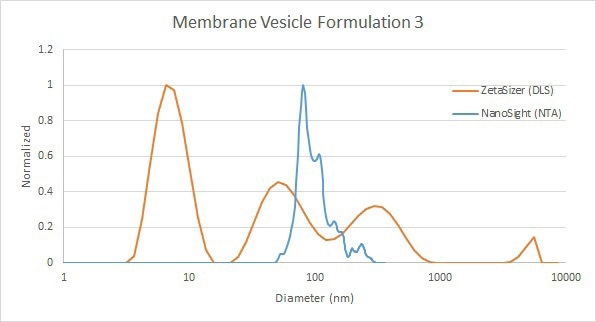
Figure 7. Comparison of membrane vesicle analysis by DLS (red) and NTA (blue).
Aggregation of Antibody-Gold Conjugates
The below example is a study extracted from a paper focusing on the functionalization of gold nanoparticles using an antibody (mouse IgG)[1]. The data shows the change in absolute size at various antibody concentrations. Both techniques reflect exactly the same trend, but DLS shows amplified changes probably due to the intensity-weighted emphasis towards larger sizes in a sample, as observed in earlier examples.
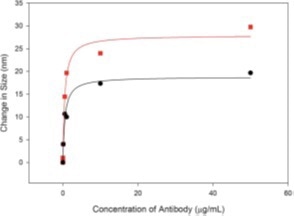
Figure 8. Size change as a function of antibody concentration, as measured by DLS (red) and NTA (black).
Liposome-Hyaluronic Acid Hybrid Nanoparticles
In this study, hybrid nanoparticles were evaluated as a platform for intranasal vaccination with subunit antigens[2]. Here, zeta potential and size were analyzed as a function of hyaluronic acid (HA) polymer concentration. The size of these hybrid nanoparticles gradually increased upon addition of an increasing amount of HA to the unilamellar liposomes.
Adding more than 300 µg of HA resulted in non-homogenous aggregation, as indicated by an abrupt and significant increase in particle size and polydispersity index (PDI) values. These results are further explained by the zeta potential measurements, which display consistently positive values until the addition of over 300 µg of HA.
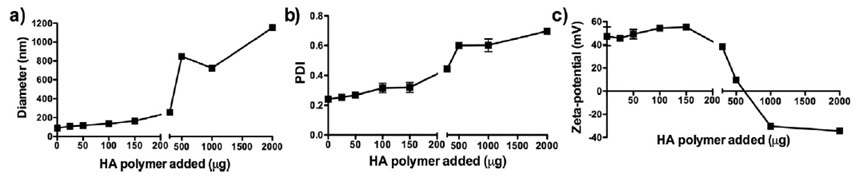
Figure 9. DLS characterization of liposomes with varying amounts of HA polymer: a) z-average size; b) PDI; c) zeta potential.
Above this concentration, a sharp decrease in the zeta potential is observed, ultimately reaching negative values at high loadings. During this transition, it is most likely that the system will aggregate considerably, due to the reduction in electrostatic stabilization forces.
These DLS readings (and electrophoretic light scattering for zeta potential measurements) were generally confirmed by the NTA results, which are also a valuable orthogonal technique for confirmation. The NTA number distributions were able to reveal the increasing aggregate tail upon the addition of HA.
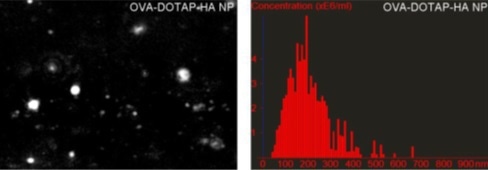
Figure 10. NTA characterization of liposomes with varying amounts of HA polymer confirmed DLS results.
Conclusion
The examples covered in this article show some of the challenges that can be addressed with a broader range of characterization information and a combination of technologies. The following list may be helpful in establishing the advantages of each individual technique when only one of the techniques is available:
NTA can be considered when:
- DLS measurements need to be validated or confirmed
- Sample is too dilute for DLS
- Sample is fluorescent
- Particle count or concentration is needed
- Number-based high-resolution sizing is needed
- Accurate distribution shape or width, or where the tails of the distribution are critical
- A direct view of sample is needed when results from other techniques are not clear
DLS can be considered when:
- Accurate and repeatable mean size and polydispersity index measurements are needed in accordance with ISO standards
- Excellent reproducibility is needed
- Comparison of different batches or quality control is of interest
- The broadest size range needs to be covered, especially above 800 nm and below 30 nm
- A noninvasive, rapid and reliable assessment of particle size is needed
- A broad concentration range is desired or diluting the sample for NTA is not possible
- Size versus time and size versus temperature is of interest for stability assessment
References
1. James A. & Driskell J. Monitoring gold nanoparticle conjugation and analysis of biomolecular binding with nanoparticle tracking analysis (NTA) and dynamic light scattering (DLS), DOI: 10.1039/c2an36467k
2. Fan Y. et al. Cationic liposome-hyaluronic acid hybrid nanoparticles for intranasal vaccination with subunit antigens, Journal of Controlled Release 208 (2015) 121–129

This information has been sourced, reviewed and adapted from materials provided by Malvern Panalytical.
For more information on this source, please visit Malvern Panalytical.