TMC has specialized in providing vibration isolation systems and precision working surfaces for precision measurement laboratories and industry for more than three decades. Precision “tops” and their supporting isolators need to be designed to tackle the key issue of controlling environmental noise for optimal performance.
Sources of Vibration (Noise)
A payload can be disturbed by three primary vibration (noise) sources: acoustic noise, ground vibration, and “direct force” disturbances. Seismic or ground vibration exists in all environments in the world.
This noise has several sources, such as waves washing coastal shorelines, the non-stop grind of tectonic plates, wind blowing buildings and trees, and man-made sources like HVAC systems, machinery, street traffic, and people’s walks. Vibration isolation systems made by TMC minimize the effect of such vibration sources.
Although acoustic noise comes from many of the same sources, it is transmitted via air pressure waves to the payload. The waves produce forces directly on the payload. A payload can be disturbed even by subsonic acoustic waves when they act as a differential pressure on the pneumatic isolator diaphragms.
Another source of “acoustic” noise is the air currents produced by the proximal HVAC vents. TMC manufactures acoustic enclosures for OEM applications that protect payloads from such types of disturbances by offering an energy-absorbing, heavy and almost airtight, enclosure over the entire payload.
Although acoustic noise is measurable, its impact on a payload depends on many factors that are not easy to estimate (such as a payload’s acoustic (cross-section)). Usually, acoustic noise is the major noise source of vibration above 50 Hz. The analysis of this kind of noise source is not within the scope of this discussion.*
Forces applied directly on the payload are the third source of vibration. Such forces may be a direct mechanical coupling, including vibration being conveyed to the payload via a hose, or a laser water cooling line.
These forces can also originate from the payload itself, such as in the case of semiconductor inspection equipment where silicon wafers are positioned using moving stages. The force that is used to accelerate the stage is also applied as a reaction force to the “static” portion of the payload.
Moving stages also shift the payload’s overall center-of-mass (COM). Reducing such vibration sources can be carried out passively, using TMC’s MaxDamp® series of isolators or with active use of feedback or feedforward techniques. Payload-generated sources of noise are generally well-known and do not need any measurements for the purpose of characterization.
A good payload design helps to reduce the effect of vibration conveyed on to the payload. TMC provides a broad range of breadboards, honeycomb optical tables, and platform laminations, which are available in standard and custom sizes and shapes. The effect of environmental noise is reduced through high resonant frequencies and excellent damping characteristics.
Measuring Noise
Seismic (floor) noise needs to be measured, as it is not generally known in advance. There are two types of seismic noise sources: coherent or periodic noise, and incoherent or random noise. The first type is measured using an amplitude spectrum while amplitude spectral density is used to measure the second.
To determine the expected vibrational levels on a payload, the two need to be combined with the vibration transfer function for the isolation system supporting it.
Periodic Noise
Periodic noise generally originates from rotating machinery with the common example being the large fans used in HVAC systems. These fans rotate at a steady rate and produce a non-stop, single-frequency vibration (and sometimes several harmonic frequencies as well).
An air compressor is another common source of periodic noise. Air compressors cycle on and off according to demand, unlike building fans. Compressors are considered periodic and coherent noise sources, although they are non-stationary, so measurements can vary depending on whether the source is active. Periodic noise sources need to be measured by considering an amplitude spectrum measurement, whether they are stationary or not.
An amplitude spectrum measurement is made by taking the Fourier transform of data collected from a sensor used for noise measurement. An accelerometer is the most common sensor and produces a spectrum where the units of acceleration are a function of frequency.
Accelerometers are widely used as they have a “flat” frequency response. Random ground noise is often fairly“flat” in acceleration (as seen in the Section on Random Noise). Amplitude spectrums can be indicated as velocity or position amplitudes as a function of frequency.
Many spectrum analyzers use the Fast Fourier Transform (FFT). An FFT analyzer determines the amplitude of all frequencies existing in the input data and plots them. This includes the frequencies and amplitudes of periodic noise sources. The amplitudes measured using an amplitude spectrum, are independent of the length of the data record.
Random Noise
An amplitude spectral density is used to measure incoherent or random noise. Before it is displayed by the analyzer, the amplitude spectrum is multiplied by the square root of the data record’s length. The result is a curve that measures the random noise with units of [units] / √Hz, where [units] may be velocity, acceleration, or position.
This normalization for measuring bandwidth ensures that the measured noise levelis independent on the data record length.** Without making this correction, for example, the random noise level would appear to have decreased by a factor of 10 when the data record length is increased by a factor of 100.
Periodic noise sources will appear to grow in amplitude if the data record length is increased when the spectral density is used. Random ground noise levels can vary greatly, but an “average” site can have 0.5 µg / √Hz of noise between one and several hundred Hz.
Random noise can also be moving. For instance, stormy weather can increase random seismic noise levels. Figure 1 shows common noise levels prevalent in buildings.***
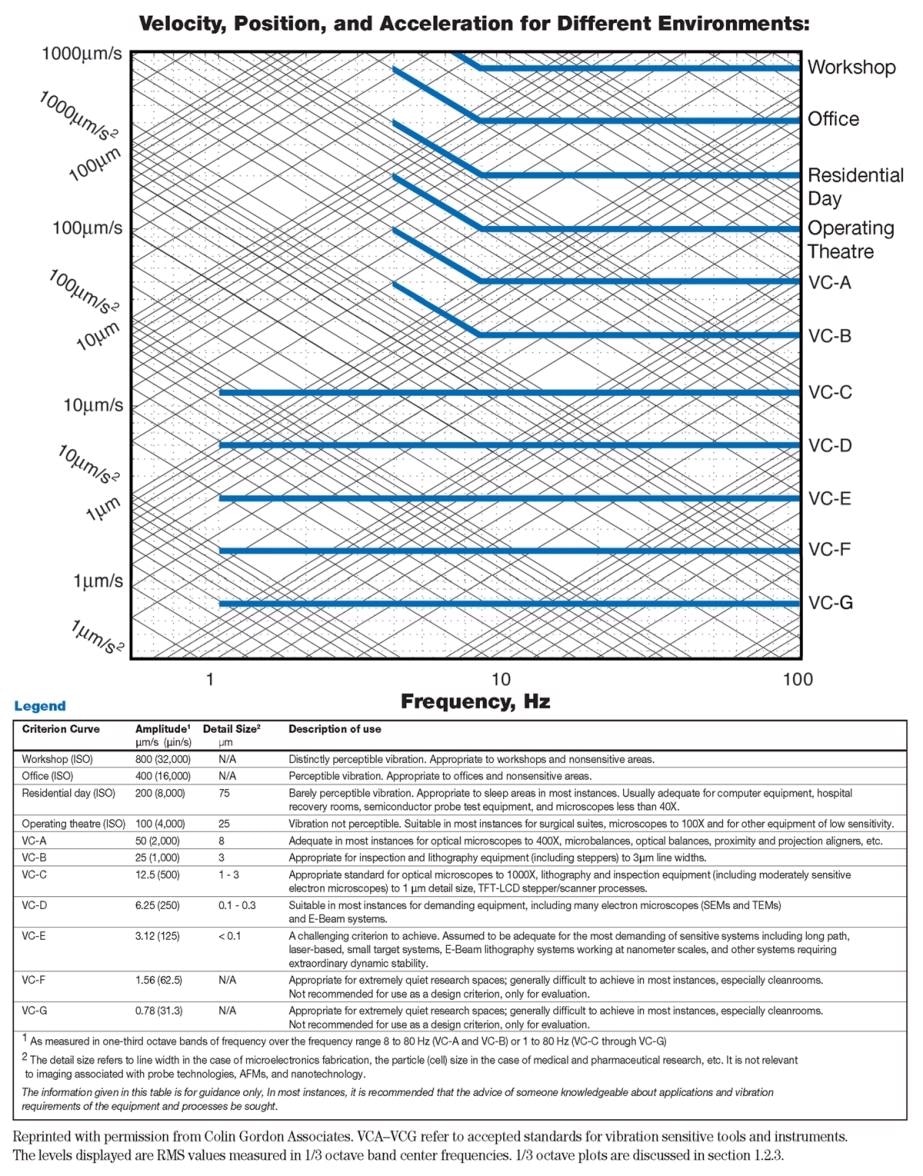
Figure 1
Measuring RMS Values
As several locations have a mixture of periodic and random noise sources, it is helpful to have a single number characterizing the noise levels. This can be done by referring a root-mean-squared (RMS) noise level in a specific frequency range.
This can be easily carried out by integrating the power spectral density (PSD) over the desired frequency range, where PSD is the square of the amplitude spectral density. This results in an equation for the RMS motion between two frequencies f1 and f2 as given below:
 |
[1] |
This expression accurately calculates the RMS value of the measurement by considering random and periodic noise sources. Several spectrum analyzers can perform this integration as a built-in function. The effect on the RMS value from any single periodic source is measured using the amplitude spectrum, and dividing the peak value by √2.
The contribution from many peaks can be put together by adding them in quadrature. Sometimes, RMS values can be indicated in “1/3 octave plots” where a histogram of the RMS values calculated in 1/3 octave frequency bins is displayed as a function of frequency. An octave is a factor of 2 in frequency.
Characterizing Isolators
The payload noise level can be estimated by determining the ground noise, then multiplying the spectra by the isolation system’s transfer function. The transfer function is a dimensionless multiplier, which is specified as a function of frequency and is usually referred to as the isolator’s transmissibility.
The transfer function is typically plotted as the ratio of table motion to ground motion as a function of frequency. Transmissibility is commonly expressed in decibels (dB).
 |
[2] |
In practice, other noise sources acting on the payload (such as acoustic noise) can corrupt the measurement of the transfer function for an isolation system. This is the primary reason why many measured transfer functions are noisy. To improve the quality of a transmissibility measurement, a “shake table” can be used. Although it is risky as it can misrepresent the performance of the system at low levels of vibration.
* See Cyril M. Harris, Ed., Shock and Vibration Handbook, Third Ed. (The McGraw-Hill Companies, 1987)
** Other normalizations often apply such as corrections for “data-windowing” which is beyond the scope of this text. See “The Fundamentals of Signal Analysis,” Application Note Number 243. Hewlett Packard Corporation.
*** Reprinted with permission from Colin Gordon Associates. VCA–VCE refer to accepted standards for vibration sensitive tools and instruments. The levels displayed are RMS values measured in 1/3 octave band center frequencies.

This information has been sourced, reviewed and adapted from materials provided by TMC.
For more information on this source, please visit TMC.