Polysaccharides are abundant, biological polymers composed of monosaccharides, or sugars. These are a diverse group of naturally-occurring materials and have been used in many applications, ranging from bioengineering and bioprinting, paper and cotton manufacturing, gelling agents in food, pharmaceuticals and other consumer products.
The production of these items requires Researchers and Manufacturers to isolate and identify polysaccharides with specific molecular properties, such as intrinsic viscosity, molecular size and molecular weight that are suitable for each particular application. Therefore, it is important to perform accurate analysis and molecular weight characterization of polysaccharides.
Gel Permeation Chromatography (GPC), or its equivalent, Size-Exclusion Chromatography (SEC), is a technique that is extensively used to characterize different types of macromolecules, ranging from natural polymers and proteins to bulk manufactured materials. Using this technique, the molecular weight moments (Mw, Mn), hydrodynamic radius (RH), dispersity (Mw/Mn) and intrinsic viscosity (IV) of these macromolecules can be measured. A complete setup of Malvern Panalytical’s OMNISEC GPC/SEC system is shown in Figure 1.
A brief summary of how GPC/SEC works: a liquid mobile phase carries a solvated sample through an analytical column that is full of porous gel particles. Here, the macromolecular components are separated in a diffusion-controlled fashion, which is eventually viewed by different detectors as each slice of sample elutes. The samples elute depending on the molecular size, with the larger molecules eluting first. It must be noted that the elution order of the samples is not based on the molecular weight, but on the molecular size. A standard advanced detection GPC/SEC setup consists of viscometer, refractive index (RI), light scattering detectors, and sometimes, a UV/ Vis photodiode array detector.
This article shows how advanced detection GPC/SEC is used to analyze three polysaccharide samples. Comparisons are made between the three samples, emphasizing the benefits of advanced detection compared to conventional methods with a single detector.
Figure 1. Malvern Panalytical’s OMNISEC Tetra Detection GPC/SEC System
GPC/SEC Results
For the experiment, three polysaccharide samples (1, 2, and 3) were prepared in water at concentrations of approximately 0.5 mg/mL for GPC/SEC analysis in a mobile phase of Phosphate-Buffered Saline (PBS). The prepared samples were then examined using 2 × Malvern Panalytical A6000M columns + 1 × A7000 column at a flow rate of 0.75 mL/minute with injection volumes of 100 µL. Figures 2–4 show the triple detector chromatograms for the polysaccharide samples. The RI signal is indicated in red, the low and light scattering detector is black, the right-angle light scattering detector is green, the viscometer signal is blue, and LogMW is indicated as a gold line. It must be remembered that the large peak extending off-scale on the RI signal is caused by the sample dissolution solvent, in this case water, being different than the mobile phase of PBS.
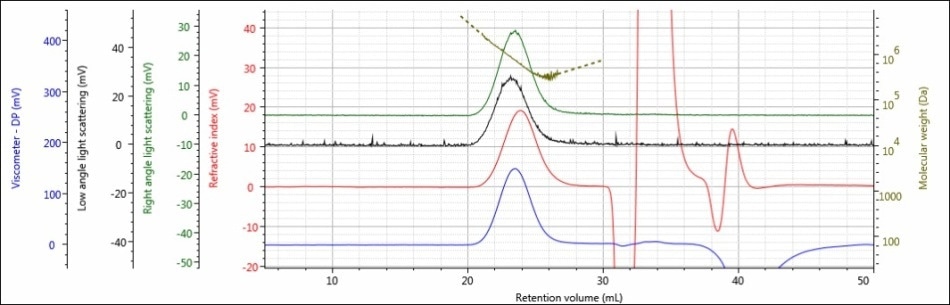
Figure 2. Triple detector chromatogram of sample 1
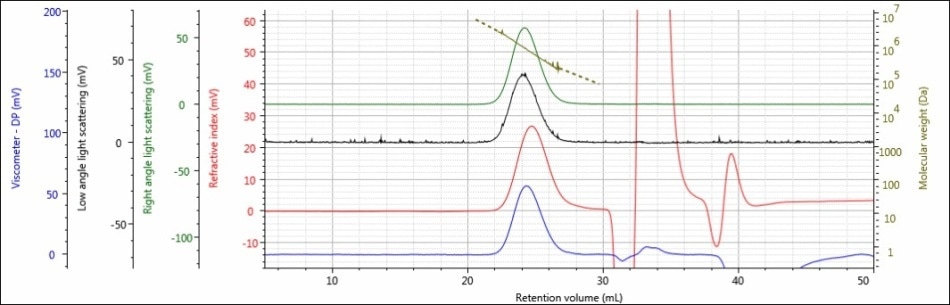
Figure 3. Triple detector chromatogram of sample 2
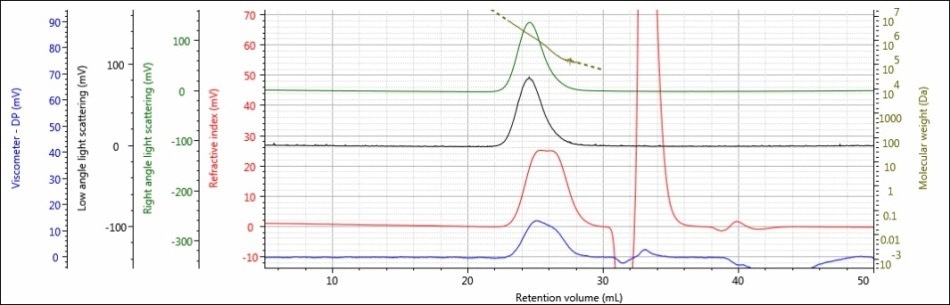
Figure 4. Triple detector chromatogram of sample 3
Good chromatography was shown by all the three samples, as shown by the consistently decreasing LogMW plot across the sample peaks and the detector signals returning to baseline. When the retention volume of each sample was briefly examined, it was found that sample 1 elutes at the lowest elution volume (earliest elution time), and this is followed by sample 2 and then by sample 3. This trend is shown in the overlay of the refractive index chromatograms (Figure 5).
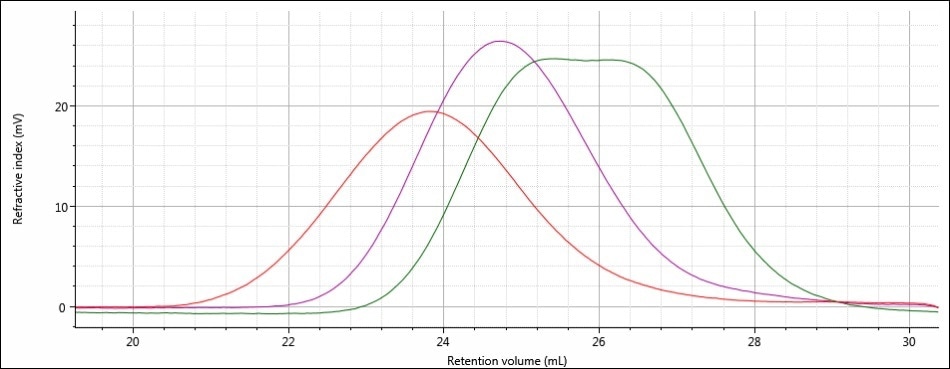
Figure 5. Overlay of refractive index chromatograms of samples 1 (red), 2 (purple) and 3 (green)
From this comparison, it can be concluded that the largest molecular size is exhibited by sample 1, followed by sample 2, and then finally by sample 3, which has the smallest molecular size. Again, it must be noted that the term molecular size was used to make the comparisons depending on the elution order of the samples, and not on the molecular weight. In majority of cases, both molecular weight and molecular size follow the same trends, but this is not necessarily true for all samples.
Calculated Molecular Data
To further analyze these samples, the molecular characterization data for samples 1, 2, and 3 are depicted in Table 1. Mn, Mw, Mw/Mn, RH, and IV are the presented values. The dn/dc used for analysis was 0.148, which is typical of polysaccharides in aqueous media. Data for three injections are shown, together with relative standard deviations.
Table 1. Molecular characterization data for samples 1, 2, and 3; Mw, Mn in Da.
| Sample ID |
Mw |
Mn |
Mw/Mn |
IV (dL/g) |
Rh (nm) |
dn/dc |
| 1 A |
595,800 |
473,700 |
1.258 |
9.377 |
43.77 |
0.148 |
| 1 B |
621,300 |
489,900 |
1.268 |
9.711 |
44.83 |
0.148 |
| 1 C |
606.300 |
481,300 |
1.260 |
9.466 |
44.10 |
0.148 |
| Average |
607,800 |
481,633 |
1.262 |
9.518 |
44.23 |
0.148 |
| SD |
12,816 |
8,105 |
0.005 |
0.173 |
0.54 |
- |
| %RSD |
2.11 |
1.68 |
0.42 |
1.82 |
1.23 |
- |
| Sample ID |
Mw |
Mn |
Mw/Mn |
IV (dL/g) |
Rh (nm) |
dn/dc |
| 2 A |
685,200 |
387,400 |
1.769 |
2.492 |
28.96 |
0.148 |
| 2 B |
670,800 |
387,100 |
1.733 |
2.461 |
28.59 |
0.148 |
| 2 C |
671.100 |
392,300 |
1.711 |
2.434 |
28.57 |
0.148 |
| Average |
675,700 |
388,933 |
1.738 |
2.462 |
28.71 |
0.148 |
| SD |
8,229 |
2,919 |
0.029 |
0.029 |
0.22 |
- |
| %RSD |
1.22 |
0.75 |
1.69 |
1.18 |
0.77 |
- |
| Sample ID |
Mw |
Mn |
Mw/Mn |
IV (dL/g) |
Rh (nm) |
dn/dc |
| 3 A |
1,210,000 |
524,700 |
2.305 |
0.637 |
21.29 |
0.148 |
| 3 B |
1,242,000 |
525,500 |
2.364 |
0.661 |
21.50 |
0.148 |
| 3 C |
1,239,000 |
531,300 |
2.332 |
0.660 |
21.53 |
0.148 |
| Average |
1,230,333 |
527,167 |
2.334 |
0.653 |
21.44 |
0.148 |
| SD |
17,673 |
3,602 |
0.03 |
0.014 |
0.13 |
- |
| %RSD |
1.44 |
0.68 |
1.27 |
2.08 |
0.61 |
- |
From the above numerical data, the molecular size trend observed from the elution order of the samples is validated by the hydrodynamic radius values measured for each sample. Samples 1, 2, and 3 have an RH of about 44 nm, 29 nm, and 21 nm, respectively, but the molecular weight trend of the samples is the reverse of the molecular size trend. It was observed that sample 1 had a molecular weight of approximately 608 kDa, sample 2 was about 676 kDa, and sample 3 had about 1,230 kDa - the highest molecular weight. If this analysis had been made using standard calibration, which depends on a single concentration detector, and a calibration curve that establishes the molecular weight based on retention volume, then the molecular weight trend would have followed the molecular size trend and resulted in inaccurate data. Advanced detection uses a light scattering detector to determine the absolute molecular weight independent of retention volume and provides accurate molecular weight data, demonstrating the actual nature of these samples.
Mark-Houwink-Sakurada Data
A Mark-Houwink-Sakurada (MHS) plot is perfect for visualizing the apparently conflicting molecular weight and molecular size trends. The MHS plot shows data from two detectors — light scattering (MW) detectors and the viscometer (IV) — on the logarithmic scales to emphasize the similarities or differences between varying molecular structures. Figure 6 shows the MHS plots of all three samples.
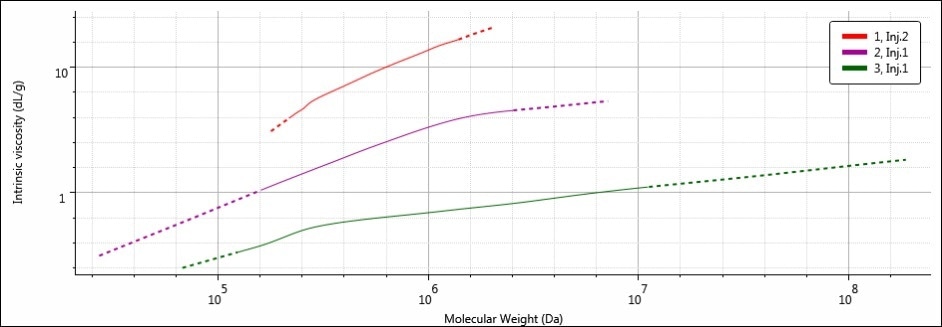
Figure 6. MHS overlay of samples 1 (red), 2 (purple) and 3 (green)
By placing IV on the y-axis, the MHS plot essentially provides a view of the molecular density of a sample’s entire molecular weight range. This is because the IV units are volume/mass, or dL/g. Further, increased IV translates to decreased molecular density. Hence, on the MHS plot, the densest materials are present at the bottom of the plot. Samples 1, 2, and 3 have different MHS plots, as predicted based on the differences in calculated molecular data. It can be seen that the width of the MHS plots corresponds to the breadth of the molecular weight distribution of each sample, especially the high molecular weight end on the right.
The highest MW in sample 3 corresponds to the MHS plot extending the furthest along the x-axis. Sample 3 was the densest of the three samples because it has the smallest RH. Therefore, its plot is the nearest to the bottom of the three (It is easy to remember: items with low density float up, items with high density sink down). The opposites are true for sample 1: it possesses the lowest MW (and narrowest molecular weight distribution) and therefore, the MHS plot for sample 1 is short and ends at the lowest molecular weight value along the x-axis. However, since sample 1 possesses the largest RH to go with the lowest MW, its molecular density is the lowest of all three samples, placing its MHS plot at the top. Sample 2 is intermediate in all of its molecular parameters, and so its MHS plot sits nicely between sample 1 and sample 3.
In this fashion, the MHS plot reveals how MW and RH are related by the structure of the polysaccharide. Sample 1 has the largest RH in spite of its lower MW thanks to its expanded and more open structure, while sample 3 possesses the smallest RH, in spite of its high MW thanks to its dense structure.
Conclusion
Advanced detection GPC is evidently the simplest and most significant technique, as demonstrated by the data presented in this article. Conventional calibration has been effectively used for many years, but the underlying assumption that MW and RH are linked together is not true. This is especially significant for new polymers as well as polymers that are naturally highly variable, for example, polysaccharides, as described in this article. Advanced detector GPC measures absolute molecular weight, independent of retention volume and molecular size, and at the same time completely characterizes the underlying structural differences between molecules and samples.
Accurate determination of the MW, as well as the RH and IV, of polysaccharides provides manufacturers and researchers the required data to create unique products for certain applications. Armed with this insight, better and more valuable products can be developed in the food, pharmaceuticals, textiles, consumer products and other industries, where these materials are employed.

This information has been sourced, reviewed and adapted from materials provided by Malvern Panalytical.
For more information on this source, please visit Malvern Panalytical.