UV-visible range microspectroscopy is a useful method for the analysis of advanced materials. This includes fluorescence, reflectance, absorbance and photoluminescence spectroscopy of sample areas on the micron scale.
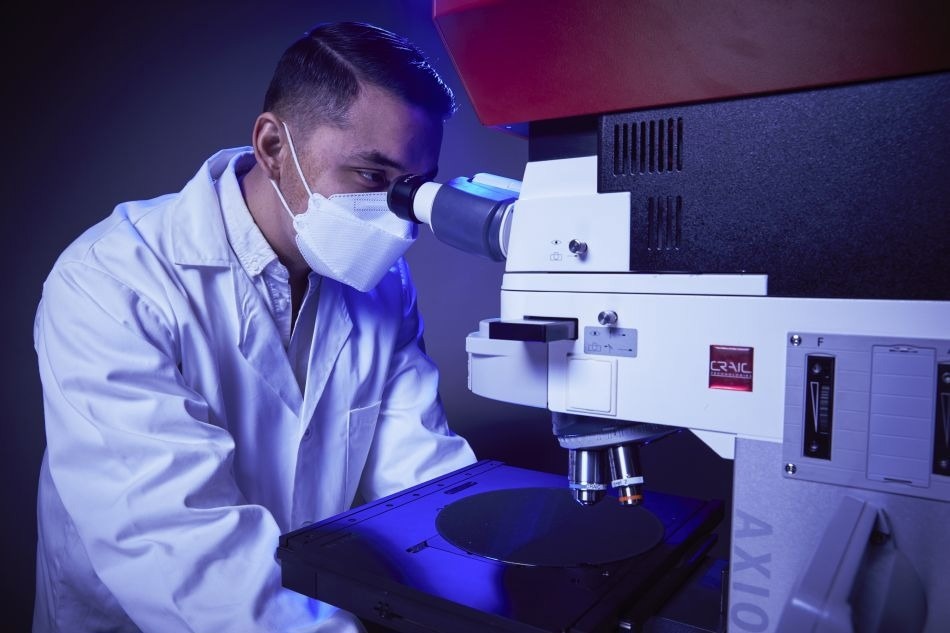
The 2030PV PRO™ UV-VIS-NIR microspectrophotometer from CRAIC Technologies. This instrument can be configured for transmission, reflectance, photoluminescence and Raman spectroscopy and imaging
In this example, gold (Au) nanorods in solution are analyzed by UV-visible-NIR range microspectroscopy.
Experiment
The 2030PV PRO™ microspectrophotometer from CRAIC Technologies offers a perfect solution with a fast, easy and non-destructive technique of examining advanced materials. For this set of experiments, the 2030PV PRO™ was configured for UV-visible-NIR absorbance microspectroscopy.
In this article, gold nanorods in solution were examined. The gold nanorods are solvated in a polystyrene sulfonate salt in PBS solution. The solution contained 10 mM polystyrene sulfonate with 0.3 M sodium chloride in 0.01% Tween 20.
The final solutions were:
(A - C): Three samples containing undiluted solutions of gold nanorods of different aspect ratios;
(D - F): Three samples containing diluted (1:100) solutions of gold nanorods of different aspect ratios;
G: One mixture of gold nanorods of two different aspect ratios
H: One mixture of gold nanorods of three different aspect ratios
For microspectral analysis, fifty scans were averaged for all the measurements in the spectral wavelength range of 400 to 850 nm. A 10X quartz objective and broadband UV-visible-NIR light were used for both micro-spectral and imaging measurements. The sampling aperture used measured 50 µm X 50 µm in size. Distilled water was used as the reference material and quartz well slides were employed to contain the reference and the sample solutions.
Measurements and Results
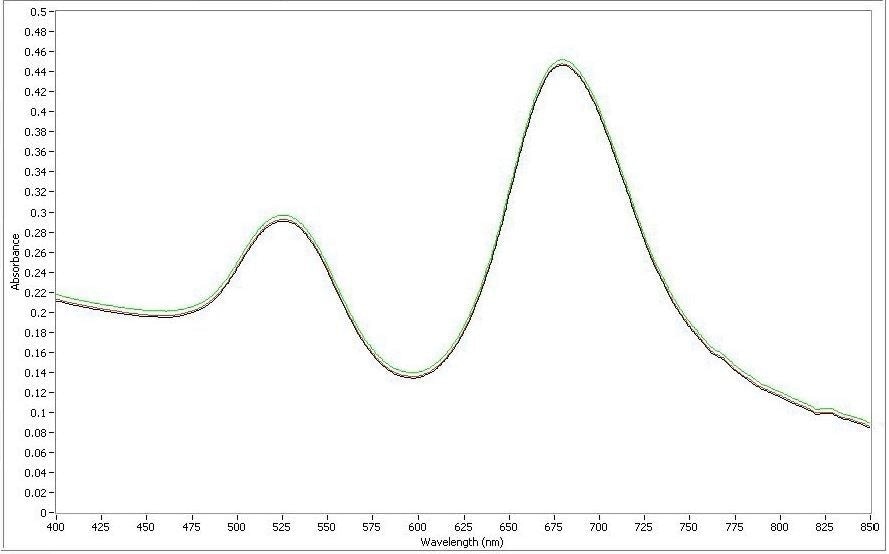
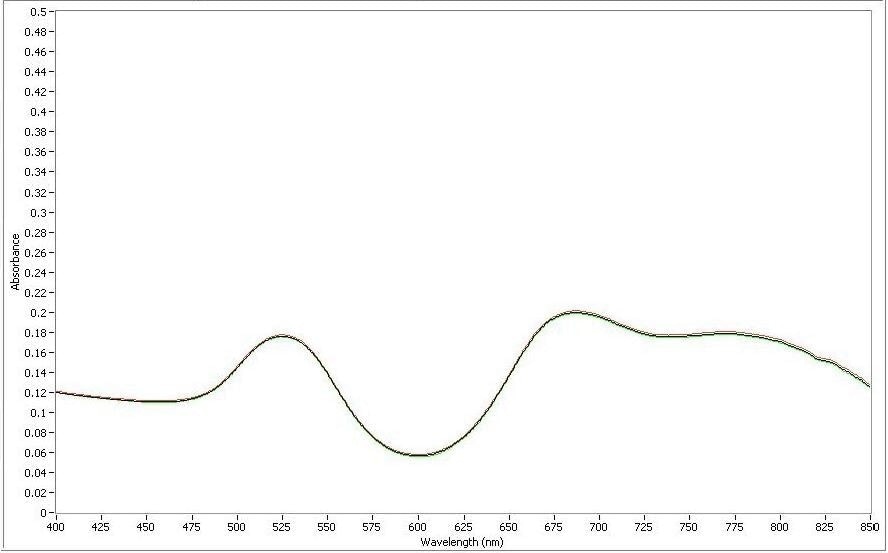
Sample A: Gold nanorods of aspect ratio 1 at full concentration.
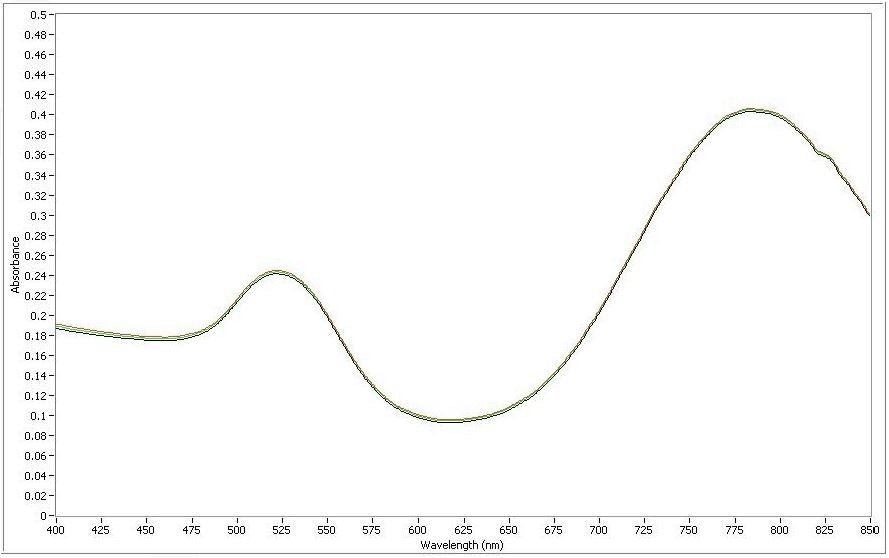
Sample B: Gold nanorods of aspect ratio 2 at full concentration.
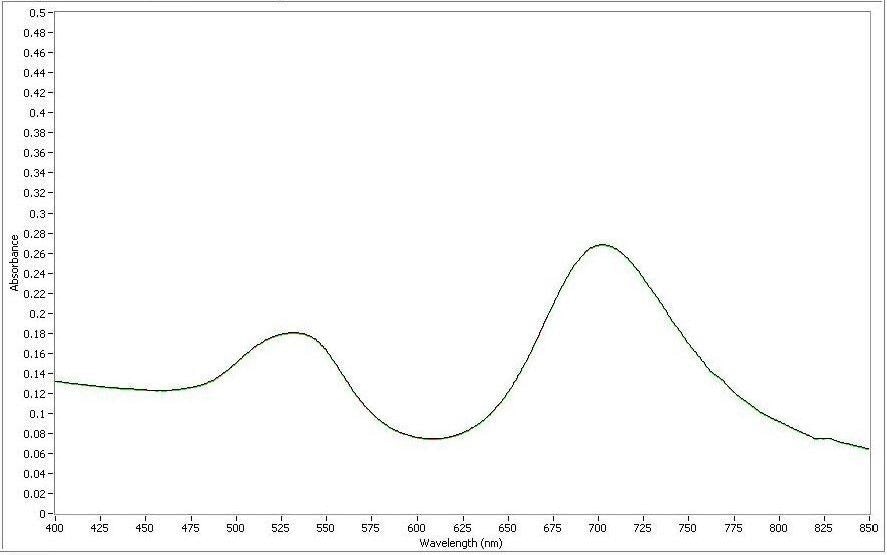
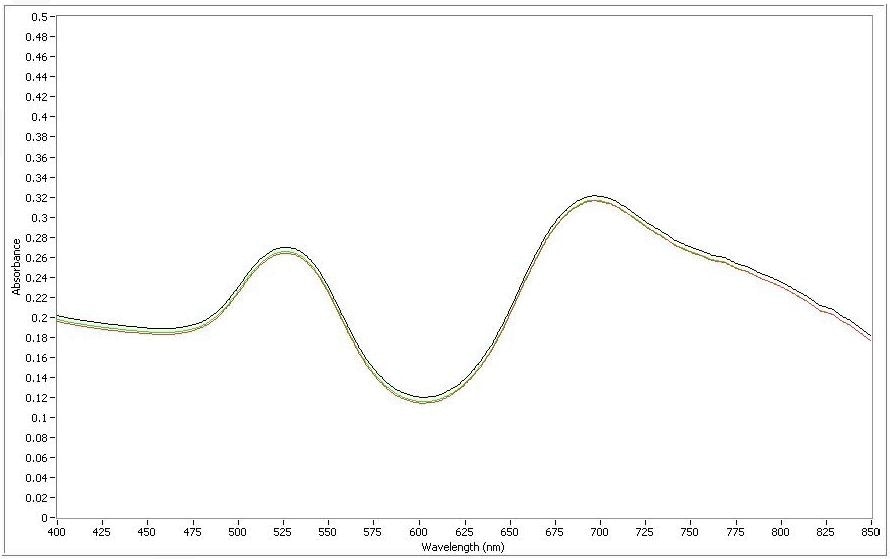
Sample C: Gold nanorods of aspect ratio 3 at full concentration.
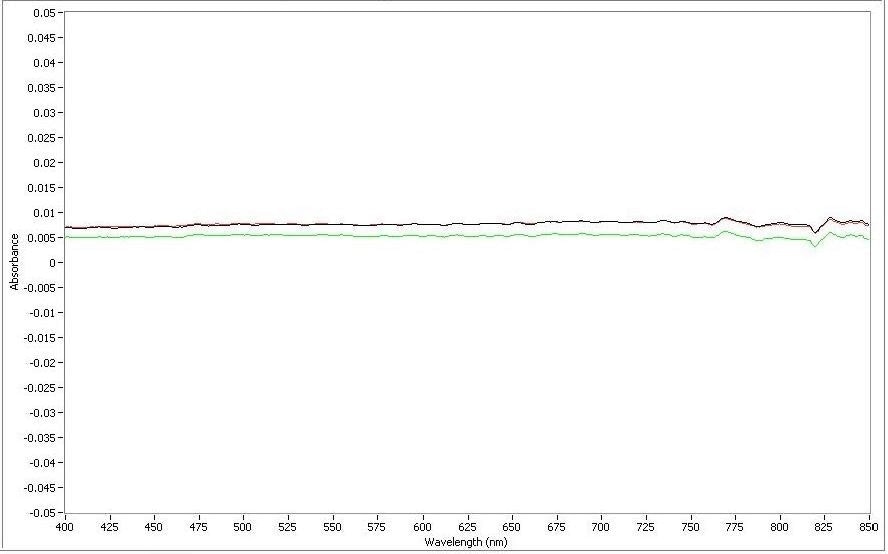
Sample D: Gold nanorods of aspect ratio 1, diluted.
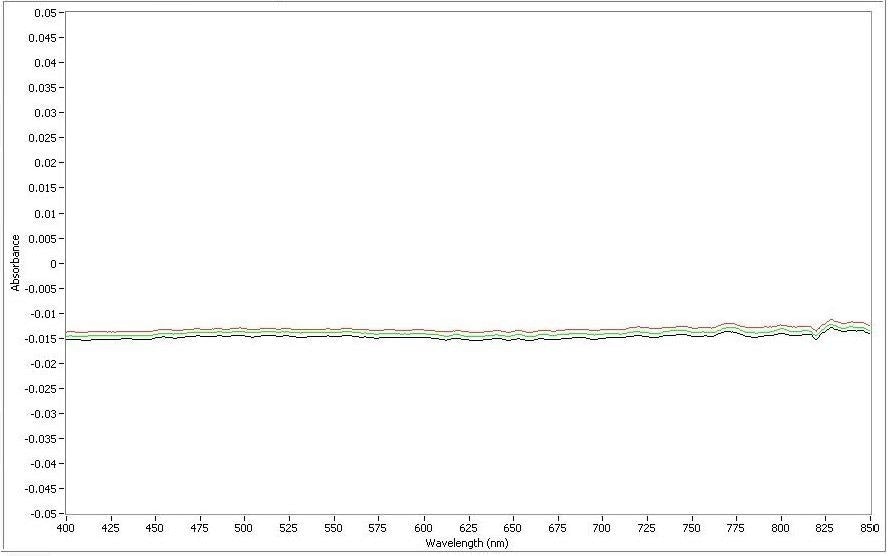
Sample E: Gold nanorods of aspect ratio 2, diluted.
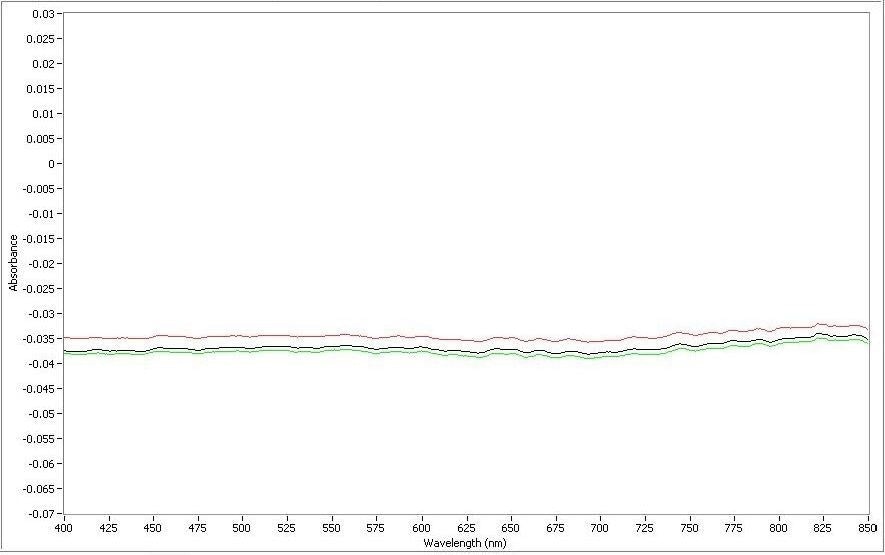
Sample F: Gold nanorods of aspect ratio 3, diluted.
Sample G: Mixture of gold nanorods of two aspect ratios.
Sample H: Mixture of gold nanorods of two aspect ratios.
Results
Absorbance microspectra were acquired from gold nanorods at various concentrations solutions. Absorbance microspectra were also acquired from blends of different aspect ratio gold nanorods in solution. Sample A showed two absorbance spectral peaks at 525 nm and 679 nm. The peak locations were 522 nm and 783 nm in wavelength for Sample B, and 532 nm and 702 nm for Sample C. The diluted solutions D, E, and F did not exhibit absorbance spectral peaks. For the mixed gold nanorods, Sample G revealed spectral peaks at 524 nm, 687 nm and 770 nm in wavelength. While Sample H exhibited 527 nm and 697 nm peak locations.
This article describes the utility of the 2030PV PRO™ microspectrophotometer in the development and analysis of microscopic quantities of materials such as gold nanorods.

This information has been sourced, reviewed and adapted from materials provided by CRAIC Technologies.
For more information on this source, please visit CRAIC Technologies.