This article shows how the Epsilon 3XLE benchtop XRF spectrometer is suitable for analyzing Na, Mg, P, Ca, Mn, Fe, Zn, Cl, and K elements in infant cereals prepared as loose powders or pressed pellets.
Instrumentation
A Panalytical Epsilon 3XLE EDXRF spectrometer was used to perform the measurements. This spectrometer is equipped with a high-resolution SDD-10 Detector, 50 kV 3 mA Rhodium anode X-ray tube, helium purge, spinner, 6 filters and a 10-position removable sample changer.
Standards
For this study, a set of 8 infant cereal powder standards comprising of Na, Mg, P, Ca, Mn, Fe, Zn, Cl and K was used. A potentiometric method for (Cl) and ICP-AES (all other elements) was previously used to determine elemental concentrations.
Sample Preparation
Pressed Pellets
A 7.5 g sample from each standard was pressed at 5 or 10 t (high fat or plant content, respectively) for 90 seconds using an automatic Herzog HTP 40 press together with a 40 mm WC pressure die to prevent Fe contamination.
Loose Powders
Next, 6 grams of each sample was transferred into a (P1) sample cup assembled with a high transmission Prolene (4 µm) supporting foil. Then, all powders were lightly compressed with a hand stamp tool.
Measurement Procedure
As shown in Table 1, four different range optimized measurement conditions were used. All analyses were conducted in a helium/air environment and the total counting time was 15 minutes. A region-of-interest (ROI) method was used to measure the intensities for Mg and Na, while all other elements were measured using completely deconvoluted spectra.
Table 1. Measurement conditions
| Condition |
kV |
µA |
Measurement time (s) |
Medium |
Filter |
Elements |
| <F-Si> |
5 |
3000 |
600 |
Helium |
None |
Na, Mg, P |
| <K-V> |
12 |
1250 |
120 |
Air |
Al-thin |
Cl, K, Ca |
| <Cr-Co> |
20 |
360 |
120 |
Air |
Al-thick |
Mn, Fe |
| <Ni-Mo> |
50 |
170 |
60 |
Air |
Ag |
Zn |
Calibration Results
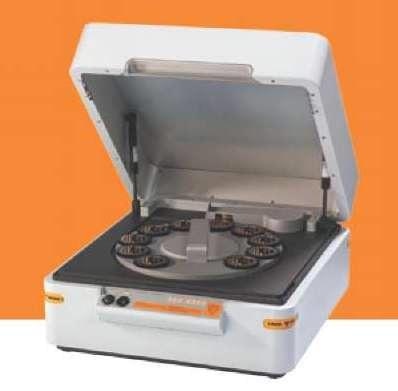
Standards were measured in triplicate. Calibration plots for K and Na are shown in Figures 1 to 4. A good correlation was observed between the chemical concentrations and the measured intensities. The detection limits (LLD) and calibration data for both preparation methods are summarized in Table 2.
Table 2. Pressed pellet and loose powder calibration results
| Compound |
Concentration range (mg/100 g) |
RMS* (mg/100 g) |
Correlation |
LLD (3σ) (mg/100 g, appl. time) |
| Pressed pellets |
Loose powder |
Pressed pellets |
Loose powder |
Pressed pellets |
Loose powder |
| Na |
6.00 - 276.50 |
14.28 |
17.62 |
0.9908 |
0.9867 |
14.3 |
71.4 |
| Mg |
16.00 - 137.50 |
7.79 |
7.13 |
0.9837 |
0.9864 |
5.0 |
25.0 |
| P |
119.50 - 557.50 |
13.93 |
16.87 |
0.9955 |
0.9934 |
2.0 |
2.5 |
| Cl |
24.50 - 454.00 |
15.20 |
14.17 |
0.9958 |
0.9964 |
2.0 |
2.0 |
| K |
84.00 - 942.50 |
17.96 |
19.61 |
0.9977 |
0.9973 |
2.0 |
2.0 |
| Ca |
163.50 - 629.00 |
18.26 |
22.10 |
0.9931 |
0.9899 |
1.2 |
1.2 |
| Mn |
0.13 - 3.40 |
0.07 |
0.06 |
0.9978 |
0.9980 |
0.2 |
0.2 |
| Fe |
4.36 - 26.30 |
0.97 |
1.06 |
0.9895 |
0.9872 |
0.2 |
0.2 |
| Zn |
1.26 - 5.45 |
0.52 |
0.74 |
0.9379 |
0.8697 |
0.2 |
0.2 |
* RMS (Root Mean Square) is an indication of the quality of the regression. The more accurate calibrations have smaller RMS values.
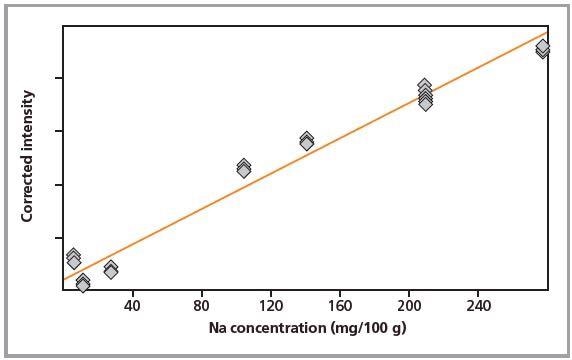
Figure 1. Calibration graph for Na in pressed pellets.
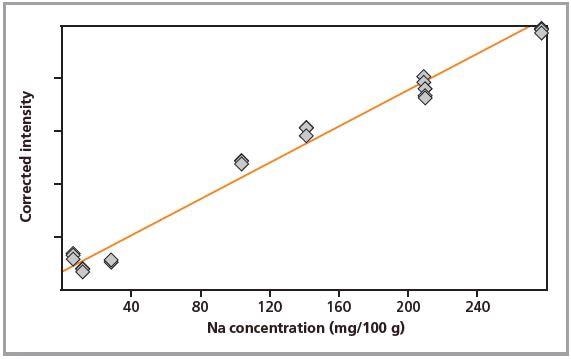
Figure 2. Calibration graph for Na in loose powders.
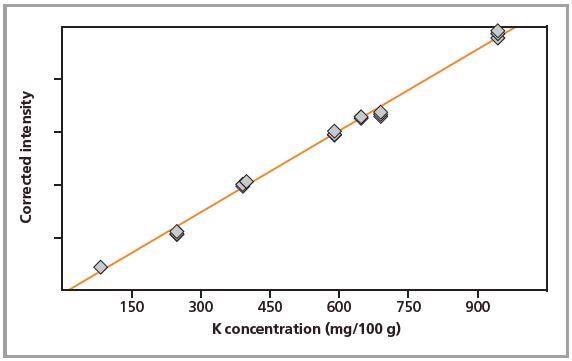
Figure 3. Calibration graph for K in pressed pellets.
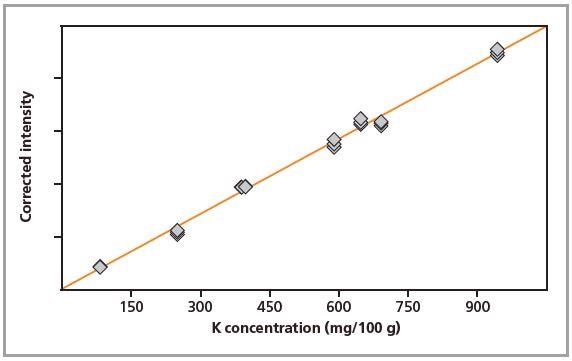
Figure 4. Calibration graph for K in loose powders.
Precision
In order to test the stability of the instrument, one pelletized sample was repeatedly measured for 20 times. Table 3 shows the average concentration, the relative RMS, and RMS (1σ) of the repeat measurements. All elements produced a relative RMS value < 1.65 %, except for Mn, owing to its low concentration, where counting statistics play a major role.
| Compound |
Average concentration (mg/100 g) |
RMS (mg/ 100 g) |
Rel. RMS (%) |
| Na |
194.79 |
2.35 |
1.21 |
| Mg |
63.15 |
0.63 |
1.00 |
| P |
414.62 |
1.24 |
0.30 |
| Cl |
438.20 |
2.31 |
0.53 |
| K |
671.67 |
1.55 |
0.23 |
| Ca |
641.14 |
1.49 |
0.23 |
| Mn |
0.15 |
0.02 |
16.53 |
| Fe |
6.54 |
0.05 |
0.69 |
| Zn |
3.47 |
0.06 |
1.61 |
Conclusion
The data presented reveals that the Epsilon 3XLE is suitable for rapid analysis of infant cereal samples. There were only slight differences between loose powder and pressed pellets preparations.
The repeatability results show the robustness and stability of the Epsilon 3XLE. The combination of high sensitivity, excellent detector resolution and powerful software deconvolution models contribute to the precision and accuracy of the results.

This information has been sourced, reviewed and adapted from materials provided by Malvern Panalytical.
For more information on this source, please visit Malvern Panalytical.