This article examines the capabilities of the Epsilon 1 — benchtop energy dispersive X-ray fluorescence (XRF) spectrometer — for analyzing Zn, Cu, Fe, Mn, Ca, K, Cl, and P elements in milk powder prepared as loose powders. The simple sample preparation process together with simultaneous and rapid measurement of elements can make the XRF technique a viable analytical method for the food industry. It enables sample analysis close to production lines.
Instrumentation
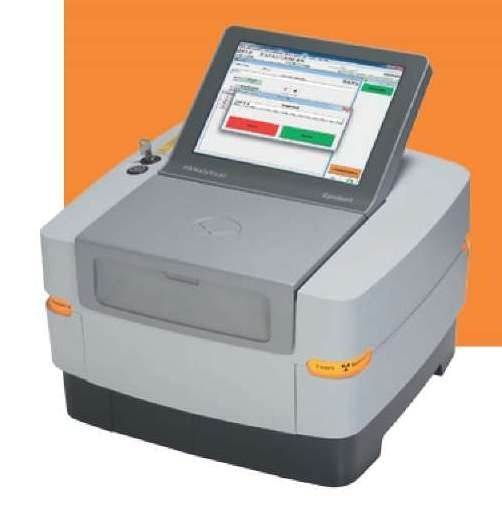
An Epsilon 1 EDXRF spectrometer was used to carry out the measurements. This spectrometer is equipped with a high-resolution silicon drift detector, 6 filters and a 50 kV silver X-ray anode tube. The Epsilon 1 software is used to automatically process the data.
Standards and Sample Preparation
Several in-house milk powder standards together with CRM milk powder standards were prepared as loose powder samples (6 g) for analysis.

Measurement Procedure
As shown in Table 1, two measurement conditions were used for analyzing Cl, K, Ca, P, Cu, Zn, Fe and Mn elements in the standards. The total measurement time taken was only 5 minutes per standard. The XRF spectrum of one such milk powder standard is shown in Figure 1.
Table 1. Measurement conditions
| Elements |
kV |
µA |
Medium |
Filter |
Meas. time (s) |
| Ca, Cl, K, P |
15 |
300 |
Air |
thin Al |
120 |
| Cu, Fe, Mn, Zn |
30 |
110 |
Air |
thick Al |
180 |
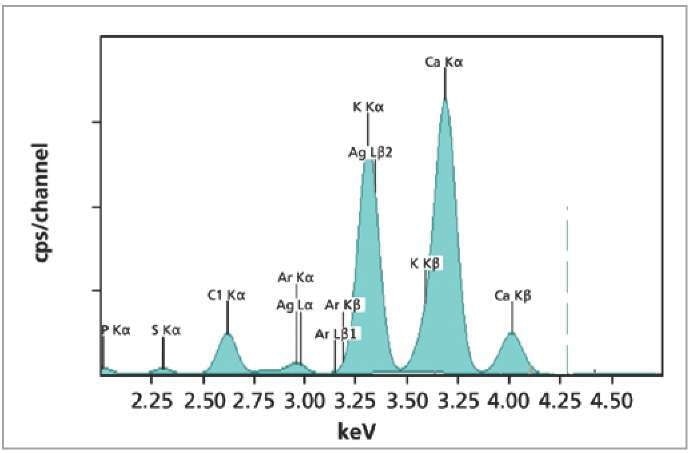
Figure 1. XRF spectrum of NIST1549 milk powder standard.
Calibration Results
The calibration graphs for Ca and Cl in milk powder are shown in Figures 2 and 3, respectively. The graphs reveal very good correlation between the measured intensities and the concentrations. Detailed calibration results are summarized in Table 2. The root mean square (RMS) value equals 1 σ standard deviation. Table 2 shows the lower limits of detection (LLD).
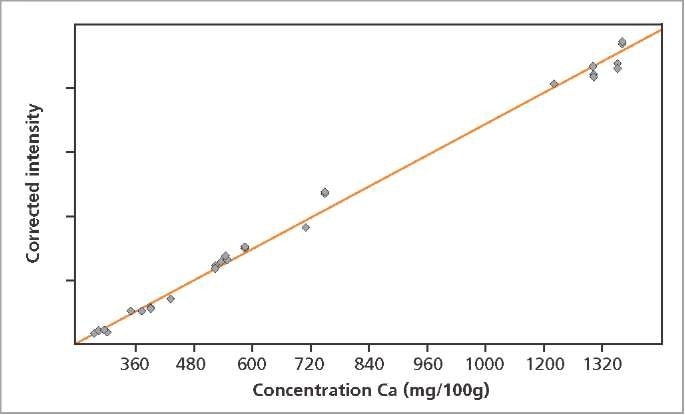
Figure 2. Calibration graph for Ca in milk powder.
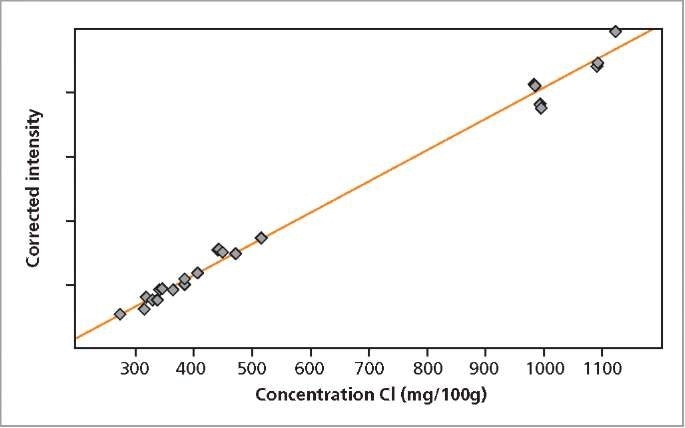
Figure 3. Calibration graph for Cl in milk powder.
Table 2. Calibration details
| Element |
Concentration range (mg/100 g) |
RMS* (mg/100 g) |
Correlation |
LLD (mg/100 g) |
| P |
211 - 1110 |
21.5 |
0.9983 |
8.6 |
| CI |
276 - 1120 |
31.8 |
0.9954 |
2.0 |
| K |
416 - 1860 |
28.1 |
0.9988 |
0.8 |
| Ca |
278 - 1360 |
27.6 |
0.9980 |
0.5 |
| Mn |
0.0063 - 4.9 |
0.042 |
0.9995 |
0.06 |
| Fe |
0.18 - 17.6 |
0.32 |
0.9976 |
0.05 |
| Cu |
0.026 - 1.98 |
0.060 |
0.9924 |
0.03 |
| Zn |
3.6 - 15.1 |
0.14 |
0.9987 |
0.05 |
(* RMS: The more accurate calibrations have the smaller RMS values)
Precision
In order to test the precision of the instrument, a milk powder sample was measured twice daily for 6 days consecutively. Table 3 shows the average concentration and RMS value. All elements demonstrate excellent repeatability. The high relative RMS values for Cu and Mn are the result of very low concentrations of these elements in the milk powder sample.
Table 3. Repeatability results over 6 days using a milk powder sample
| Element |
Average conc. (mg/100 g) |
RMS (mg/100 g) |
Rel. RMS (%) |
| P |
234 |
3.8 |
1.6 |
| CI |
275 |
5.3 |
1.9 |
| K |
434 |
3.6 |
0.8 |
| Ca |
363 |
2.8 |
0.8 |
| Mn |
0.03 |
0.014 |
39 |
| Fe |
5.1 |
0.24 |
4.8 |
| Cu |
0.21 |
0.03 |
12.5 |
| Zn |
3.7 |
0.1 |
2.9 |
Conclusions

The results clearly show the excellent capability of the Epsilon 1 EDXRF spectrometer for the rapid analysis of milk powders. The sensitivity and high resolution of the silicon drift detector, in combination with powerful software deconvolution algorithms, can make it possible to quantify vital elements in milk powder production.
The simple sample preparation together with simultaneous and rapid measurement of elements can make Epsilon 1 well-suited for at-line analysis for the food industry. In addition, the repeatability of the measurements shows that the Epsilon 1 is an ideal instrument for analyzing milk powders in loose powder form.

This information has been sourced, reviewed and adapted from materials provided by Malvern Panalytical.
For more information on this source, please visit Malvern Panalytical.