This application note examines the requirements for the measurement of small sample volumes using laser diffraction, in terms of measurement sensitivity and how reproducible measurements can be achieved.

Image Credits: TTP999/shutterstock.com
When Small Sample Volumes Need to be Measured
It can often be the case that the volume of sample available for particle size analysis is minimal. In the case of pharmaceutical product development, the particle size of NCEs may need to be measured early in the product development cycle when only a few milligrams of material exists.
This not only requires the ability to carry out measurements using small sample volumes but also necessitates sample recovery following any measurements. For the routine characterization of highly active pharmaceuticals or toxic compounds, sample volumes must be minimized in order to reduce operator exposure. Finally, even if large amounts of material are available, it may be desirable to measure small amounts of material to cut down on the use of expensive or volatile dispersants.
Method Development for Small Sample Volumes
The key challenge associated with carrying out laser diffraction measurements on small sample volumes is that of obtaining reproducible results.
Both the sampling of the material and dispersion must be tightly controlled in order to obtain meaningful results. This can be difficult to achieve when method development and measurement have to be carried out using just a few milligrams of powder.
Obtaining Representative Samples and Acquiring Meaningful Data
In the case of sampling, users must ensure a representative sample has actually been selected for analysis.
It is also important that, once the sample has been placed in the instrument, the laser diffraction measurement is acquired over a long enough time period in order to ensure all the material has been measured.
Dispersion of Samples
The process of dispersion can only be understood if the effect of increasing the dispersion energy on the particle size is assessed.
In the case of dry dispersion methods, the effect of dispersion pressure on the reported particle size must be investigated. For wet dispersion methods, the effect of sonication on the sample must be understood.
Wet Measurements versus Dry Measurements
Given the requirements above, wet measurements offer many advantages when characterizing milligram sample quantities. Firstly, samples can be continuously re-circulated, allowing many measurements to be carried out. This contrasts with dry measurements where the sample passes rapidly though the measurement zone, allowing relatively few measurements to be made.
Secondly, it is possible to follow the dispersion process in real time during wet measurements, allowing both dispersion optimization and the final measurements to be carried out on a single sample. In contrast, dry measurements require the measurement of several samples to be carried out at different dispersion pressures in order to select the correct measurement conditions. Finally, full sample recovery can be achieved using wet dispersion, whereas for dry measurements the entire sample is normally lost or only a small fraction can be retrieved using a cyclone.
Sample Measurements
In order to investigate the capabilities of both wet and dry dispersion for the measurement of milligram samples, the measurement reproducibility obtained using each dispersion method was assessed for a generic pharmaceutical material (Paroxetine).
Wet Dispersion Measurements
Wet dispersion was achieved using the Hydro 2000 Micro Precision dispersion unit on the Mastersizer 3000 system. This unit was selected due to its capability to make measurements using small dispersant volumes (18 ml).
Paroxetine disperses in cyclohexane (with 0.1% w/w lecithin added). Ultrasound at an intensity of 50% was applied for 30 seconds before measurement to aid dispersion. Three 1mg aliquots were analyzed, with 5 repeat measurements being made on each in order to assess the measurement repeatability.
Dry Dispersion Measurements
Dry dispersion was achieved using the Scirocco 2000 dry powder feeder equipped with a micro-volume powder feeder tray. A pressure titration was conducted in order to determine the correct dispersion pressure.
This suggested that a pressure of 0.4bar was required to give good comparability between the dry dispersion results and those obtained using wet dispersion. A 3mg sample was found to provide enough material for a single measurement.
Measurement Reproducibility
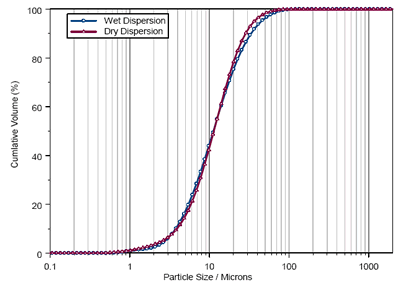
The particle size distributions obtained using wet and dry dispersion are shown in figure 1. As can be seen, similar results are obtained using each dispersion method. However, it is clear from the size distribution statistics shown in table 1 that the measurement reproducibility obtained using wet dispersion is much better than that seen for dry.
This reflects the robustness of the wet dispersion method compared to dry analysis, especially when measuring small sample volumes. The ability to measure for longer periods using wet measurements is also important in sampling the entire distribution. The data acquisition time in this case was around 50 milliseconds per measurement for dry analysis compared to 5 seconds for the wet measurements.
This sampling difference is reflected in the Dv90 values reported for the sample. The improved sampling observed using wet dispersion increases the sensitivity to material at the tails of the distribution compared to dry analysis, yielding a higher reported Dv90.
|

|
|
Figure 1. Cumulative Size Distributions Obtained for Paroxetine using Wet and Dry Dispersion.
|
Table 1. Average Results and Measurement Reproducibility for 3 separate aliquots measured using wet and dry dispersion.
| |
Dv10/ microns |
Dv50/ microns |
Dv90/ microns |
| Average |
RSD % |
Average |
RDS % |
Average |
RDS % |
| Wet dispersion |
3.78 |
2.65 |
11.20 |
0.86 |
33.29 |
1.24 |
| Dry dispersion |
3.93 |
5.72 |
11.39 |
4.17 |
28.45 |
6.12 |
Measurement Sensitivity
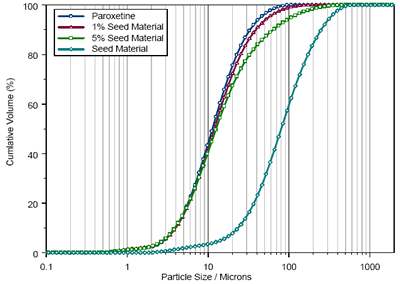
The sensitivity of the measurements possible using wet dispersion is shown in figure 2. Here, the Paroxetine sample was seeded with coarse particles at concentrations of 1% and 5% by weight in order to determine whether the dispersion method was sensitive to the presence of oversized material.
Again, measurements were carried using 1mg aliquots dispersed in Cyclohexane. The Mastersizer 3000 was able to detect the shift in the size distribution caused by the presence of the coarse material at a concentration of 1wt%.
|

|
|
Figure 2. Size distributions reported during the seeding of the Paroxetine sample with coarse material.
|
Conclusion
The ability to carry out routine measurements using milligram sample quantities is important in a variety of applications, especially when measuring toxic materials or during pharmaceutical product development.
In these cases, wet dispersion yields significant advantages over dry dispersion, providing a robust and sensitive method for assessing sample-to-sample variability.

This information has been sourced, reviewed and adapted from materials provided by Malvern Panalytical.
For more information on this source, please visit Malvern Panalytical.