Black curves are a plot of phase angle (δ) vs complex modulus (G*), containing no reference to temperature or frequency. Consequently, they are very easy to produce.
Individual data points from the frequency sweeps at all the temperatures are simply plotted on the same graph. It is even possible to use data from a fixed-frequency temperature sweep, since temperature errors do not affect the plot.
Graph Presentation
Unfortunately, there is no standardization of the graph presentation. The X-axis may be stiffness, phase angle (high values to the right) or inverted phase angle (high values to the left), with the Y-axis corresponding.
Curve Deviation For Different Samples
Elimination of temperature and frequency from the data can be useful. A series of bitumens differing in penetration, but not temperature susceptibility (penetration index), will give a single Black curve. Deviation from this curve is caused by errors of measurement, changes in composition, or variation in structure.
Effects caused by processing, ageing or polymer addition are highlighted by this form of presentation.
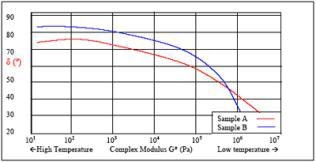
Figure 1. Black curve graph example for bitumen samples.
Interpretation Of Results
In the results shown, Sample A is a polymer modified bitumen and generally has a lower phase angle than an unmodified product, Sample B.
The lower the phase angle, the more elastic natured the asphalt binder will be and so it is less likely to form wheel ruts on a road in hot weather (modulus shown c.105). At very low temperatures (modulus c. 107), the polymer modified sample has a higher phase angle than the unmodified material, indicating that it is less likely to show cracking. At very high temperatures (modulus 101) the binder softens enough to become viscous so that it can be easily mixed and laid in position.
Conclusion
The viscoelastic nature of the asphalt is able to be easily and quickly determined using the Bohlin CVO rheometer with an ADS immersion jacket, or with a Bohlin DSR rheometer. This makes these instruments ideal tools in formulation and chemical modification of asphalts.
Measurement Conditions
| Samples |
Any asphalt cement |
| Geometry |
PP 25 mm for Original Binder or PP8 for Pressure aging vessel, with an ADS immersion cell |
| Temperature sweep |
90oC- 10oC at 1.5oC/minute |
| Sheer strain |
12% for Original Binder, 1% for Pressure Aged Vessel |
| Frequency |
10 rads/s |
| Delay time |
6.25 seconds |

This information has been sourced, reviewed and adapted from materials provided by Malvern Panalytical.
For more information on this source, please visit Malvern Panalytical.