Sponsored by HORIBAAug 15 2005
Automobile-parts production can be paralysed by a defective electron-galvanizing (EV) bath line. Because a sensitive and accurate analysis of EV solutions is fundamental to productivity, quality, and identification of errors, a detailed analytical profile can help trace the source of error and contribute to selecting the best solution. Both downtime and material cost therefore can be minimized.
Fluorescence spectroscopy is an analytical technique with high sensitivity and selectivity. By characterizing the components in the EV-coat solution with fluorescence, a detailed analytical profile can be formed for each component. This can help trace the source of errors in the EV-coat solution, and contribute to selection of the best formulation.
Quality-control tests can be preformed periodically to check for consistent bath composition.
Fluorescence Spectroscopy Instrumentation
The HORIBA FLUOROMAX® spectrofluorometer was used in this investigation. The system is compact, economical, and offers several automated accessories. The FLUOROMAX® is noted for its outstanding sensitivity, speed, and easy-to-use software.
- High sensitivity is achieved by means of all reflective optics and photon-counting detection.
- Data acquisition is fast because the system can slew at 160 nm.s–1. Coupling sensitivity and rapid data acquisition creates a system that can function as an efficient and productive laboratory instrument.
- Complete experiments can be stored in memory and recalled by a technician for push-button, menu-driven operation.
Therefore, spectra can be acquired in seconds, and a time-based scan can be collected at 1 ms/data point. Simplicity is apparent in the automation, computer-controlled variable slits, software, and calibration. For convenience, all of the controls are located in the keyboard of a PC-compatible computer.
Experimental Procedures
Samples obtained for analysis were divided into six segments. Electro-galvanizing bath (EV) was a sample of the current bath causing problems for the operator. Sample A is the plating bath that would compose the ideal EV bath. Sample B is a bath that contains 0.6 mL of starter and 1.5 mL of brightener. Sample C is a bath that contains 2 mL of starter and 0.5 mL of brightener. Starter and brightener stock samples were obtained for comparison.
Results and Discussion
The six samples were characterized by their excitation and emission spectra shown in Figures 1 through 4. The fluorescence spectra as determined by the HORIBA FLUOROMAX® spectrofluorometer could offer a possible method for correctly mixing the appropriate concentrations or proportion of starter and brightener solutions in the EV bath. For the coating process to work, a constant level of starter and brightener is necessary.
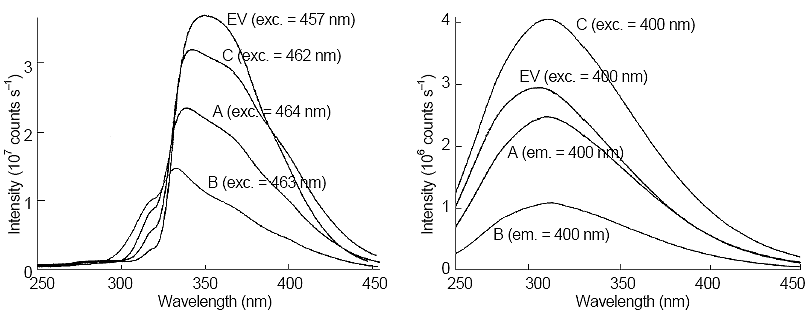
Figure 1. Comparison of excitation (left side) and emission (right side) spectra of Samples A, B, and C, along with electron-galvanizing coat bath (EV). Next to each trace, the excitation or emission wavelength is given.
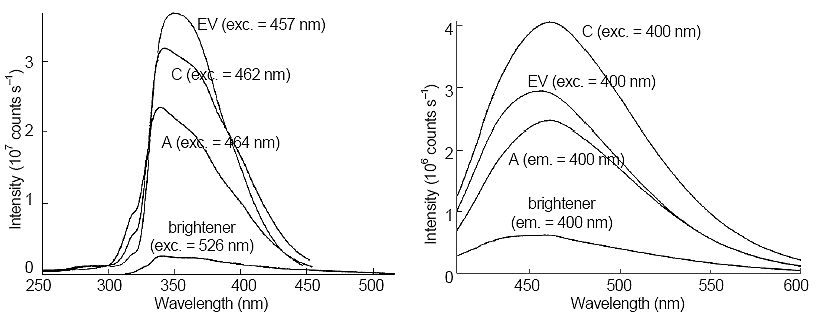
Figure 2. Comparison of excitation (left side) and emission (right side) spectra of Samples A, C, electron-galvanizing coat bath (EV), and brightener. Next to each trace, the excitation or emission wavelength is given.
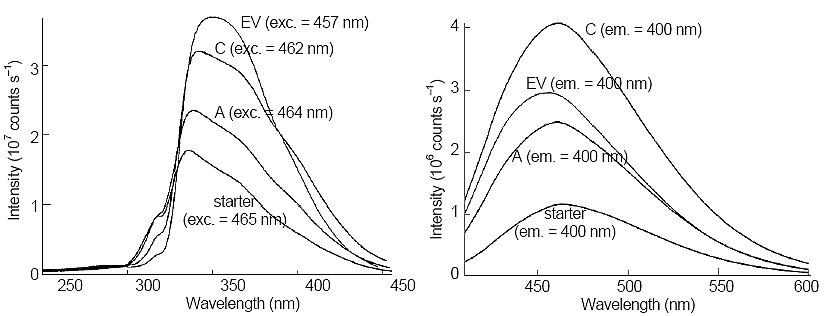
Figure 3. Comparison of fluorescence excitation (left side) and emission (right side) of Samples A, C, and a 100-fold dilution of starter solution. Next to each trace, the excitation or emission wavelength is given.
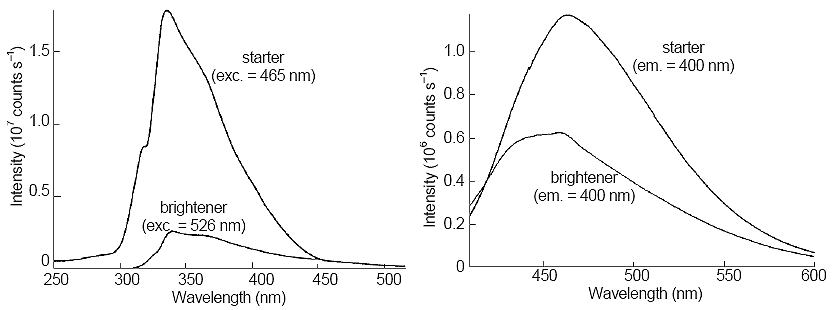
Figure 4. Excitation (left side) and emission (right side) spectra of stock solution of brightener and 100-fold dilution of starter. Next to each trace, the excitation or emission wavelength is given.
Figure 1 illustrates that sample A was 5 × 10⁵ counts lower in fluorescence intensity than the EV bath. Sample C was 106 counts higher in intensity than the EV bath. Therefore, a component in sample C must have been the cause of the greater intensity.
Sample C contained the largest amount of starter solution, the smallest volume of brightener solution. This indicates that the actual EV bath contained too much starter solution, based on the difference in fluorescence intensities.
The data were fitted to the following linear equation:
where A, B, and C are constants, [Brightener] is the concentration of brightener, [Starter] is the concentration of starter, and If is the observed intensity of fluorescence. An empirical linear relationship thus was established between the fluorescence intensity and ratio of brightener to starter.

This information has been sourced, reviewed and adapted from materials provided by HORIBA.
For more information on this source, please visit HORIBA.