Fillers are used in sealant products to reduce the cost of the material and/or to act as both a rheology control and reinforcement agent. The materials range from fumed silica, which is relatively expensive and very effective, to natural products such as calcium carbonate and silica, which are relatively cheap and not as effective.
Recently, coated precipitated calcium carbonates (CPCCs) have been used in sealants as they are effective and not as costly. The coating material is usually stearic acid which anchors to the PCC as the calcium salt during processing.
Introduction to Sealants
Sealants are used to join components together while acting as a gap filler and forming a barrier. The barrier may be necessary to exclude air, water or weather, oils, liquids or sound.
The sealant must have the following properties:
- Adhere strongly to the components to be joined
- Be easily applicable by sealant gun, manual knife or pressing
- Not slump or creep after application
- Be temperature cycle resistant
- Be cost effective and environmentally friendly
A sealant is made up of a number of components including: polymer, plasticizer, filler, pigment, adhesion promoter, curing/cross-linking system and others (e.g. desiccant, stabilizer). The filler may be as much as 40 weight per cent of the formulation and therefore has a large effect on the rheological properties of the material. The polymers used in sealant type materials include acrylics, polyurethanes and polysulfides.
Rheological Analysis of Sealants
The experiments reported in this note were performed on a Bohlin rheometer at 20˚C. A cone and plate measuring system (4˚/40 mm) was used. The sealant samples used in the study contained stearic acid modified magnesium carbonate, which had different levels of coating on its surface. The mineral was present in the formulation at ~12 weight per cent.
Pre-shear creep
In this experiment, the material is subjected to a high shear stress (2500 Pa) for a period of time long enough to break down the structure (15 sec.). This simulates the application of the sealant by, for example, a sealant gun. The shearing is stopped and immediately a constant stress is applied to the material. This test was designed to mimic the slump test which is used to characterize these materials.
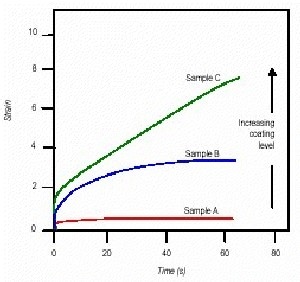
Figure 1. Plot of strain vs. time for samples A to C.
The assumption is that the larger the compliance, the greater is the amount of slump experienced by the sealant. The data in Figure 1 shows that sample A would be expected to slump less than sample B, which would slump less than sample C. The amount of coating increases from sample A to B to C. This correlates with the assumption that as the level of coating is increased the filler particles would be better dispersed, thus increasing the 'flowability' of the material.
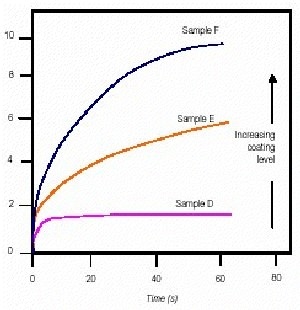
Figure 2. Plot of strain vs. time for samples D to F.
Figure 2 shows a similar plot but includes samples D to F which have progressively higher levels of coating than sample C. It is interesting to note that on increasing the level of coating from that on C to that on D, the amount of apparent 'slump' decreases. This suggests that the material has become less well dispersed and/or that the dispersing mechanism has changed. On further increasing the level of coating (from E to F) the dispersability (and thus 'flowability') appears to increase again. The experiments show obvious differences between these samples - significantly the conventional slump experiment only indicated that sample F 'slumped' more than the others, but was not discerning between samples A to E.
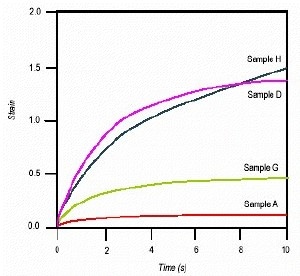
Figure 3. Plot of strain vs. time for samples A, D, G, and H. Note, samples G and H are matches for samples A and D, respectively.
The mineral used in samples G and H has been prepared by a different process to previously prepared mineral samples, but gave the same level of coating as A and D. Since differences in the 'slump' of the materials were not discernable using the conventional test, it was not possible to assess if the samples A and D had been rheologically matched. The pre-shear creep experiment shows that a reasonable rheological match had been produced in each case, particularly with samples D and H.
Note that the time axis on the graph has been expanded to show the short time-scale behavior of the samples. This time-scale more closely simulates that of interest after the material has been applied.
Stress Viscometry of the Sealants
Figure 4 shows the viscometry profiles of the two samples with the most extreme coating levels. In this experiment a stress is applied to the sample and the resulting shear-rate is measured. The viscosity is calculated from the simple relationship:
viscosity = shear stress/shear rate.
The stress is then increased stepwise and the process is repeated. The curves show that there is a discernable difference between the viscosities of the samples at low shear stresses, but the curves become asymptotic at high shears.
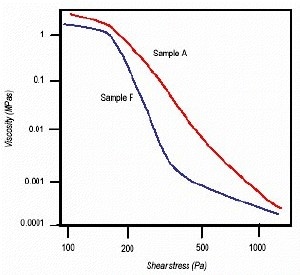
Figure 4. Plot of viscosity vs. shear stress for samples A and F.
The small differences in the samples, even at low stresses, indicates the value of using rheological experiments to simulate the deformation processes to which the materials are subjected, as in the preshear creep experiments.
Furthermore, if only high shear measurements were used to characterize the samples then differences in the materials would not be obvious.
.png)
This information has been sourced, reviewed and adapted from materials provided by Malvern Panalytical.
For more information on this source, please visit Malvern Panalytical.